AB Testing
Nov 14, 2025
How Do I Find What to Test?
Four numbers tell you where you are today and where your biggest opportunities might be hiding.

You've got a hundred ideas. Free shipping thresholds. Bundle discounts. Volume pricing. Product page changes. You could test any of them. But which one actually moves the needle?
Most brands guess. Or copy competitors. Or test whatever feels like it might work.
Here's a better approach: let your data show you exactly what to test.
What Do You Need Before You Test Anything?
Four numbers tell you where you are today and where your biggest opportunities might be hiding.
Before you test anything, pull these four numbers:
Traffic. How many people visit your site.
Conversion rate. How many of those visitors buy.
Average order size. How much customers spend per order.
Profit margin. How much you keep after costs.
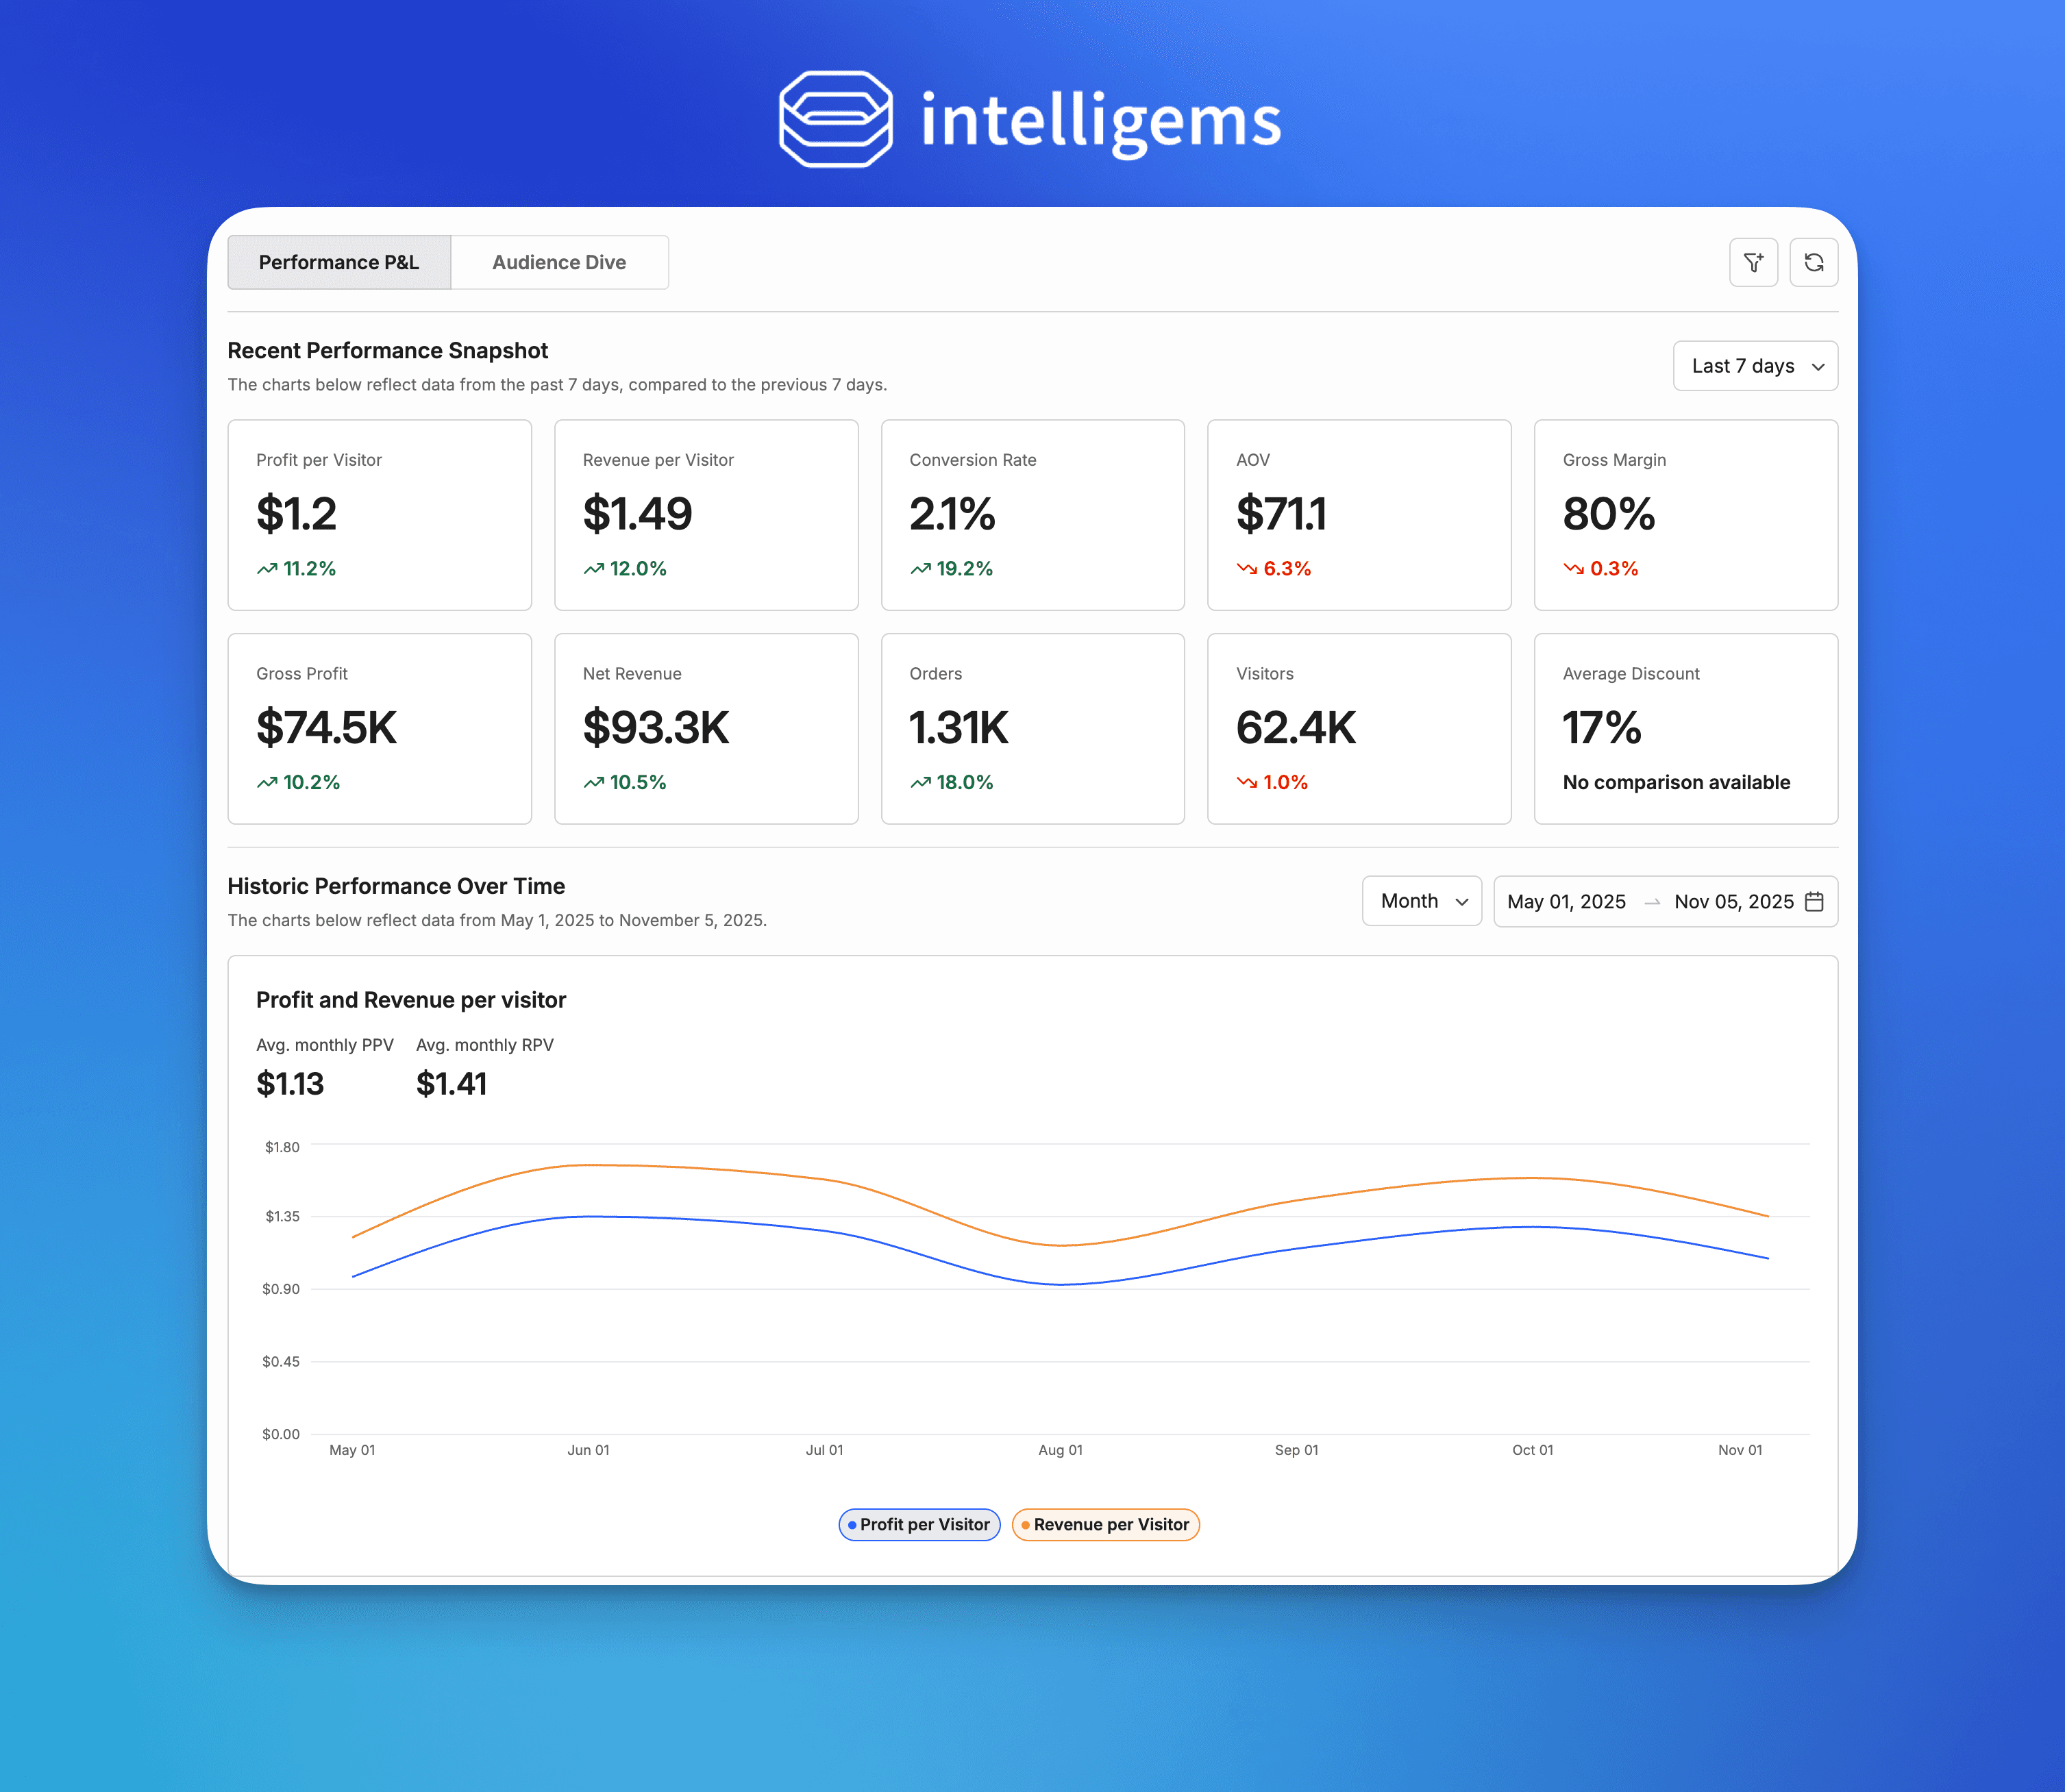
If you're using Intelligems, Sitewide Analytics shows all four metrics in one dashboard and lets you break them down by device, channel, country, and landing page. No manual exports needed.
These aren't just metrics. They're your baseline. They show you where you are today. But more importantly, they can reveal patterns that point to specific testing opportunities.
Here's what to do with them: break them down by product and category. Don't just look at site-wide averages. Dig into the details. That's where the clues appear.
Want to see how top brands use these metrics to discover testing opportunities? Watch as Jerry (GM of Advisory Services at Intelligems) breaks down the exact analytics framework for moving from data exploration to actionable tests.
Three Signals to Watch For
These aren't the only signals. Every business has different clues hiding in the numbers. But these three show up consistently and point to clear testing opportunities.
Let me give you three signals to watch for in your data.
Signal 1: High Cart Abandonment Right Before Checkout
Customers get all the way to the end. They've built their cart. They're ready to buy. Then they see the shipping cost and leave.
This could be your sign to test free shipping minimums or show shipping costs earlier in the journey. If people are abandoning at checkout after seeing an unexpected fee, removing that surprise might convert more of them.
Where to look: Check your cart abandonment data. Filter for sessions that added to cart but didn't reach checkout. If shipping cost reveals are clustered right before abandonment, you've found Signal 1.
Signal 2: Products Often Bought Together
The same two or three items show up in carts together. All the time. Customers are already naturally bundling these products.
The opportunity? Make it easier. Test offering them as a package. Give customers what they're already putting together, but faster and maybe at a slight discount.
Where to look: Pull product affinity data from Shopify Analytics or Sitewide Analytics (if you're using Intelligems). Look for product pairs or trios that appear together frequently. If the same combinations show up across dozens or hundreds of orders, you've found Signal 2.
Signal 3: Single Unit Purchases of Products That Could Be Bought in Bulk
Socks. Snacks. Supplements. Anything you use up or give as gifts. If most people are buying one, but they could buy three at a slight discount, there may be money you're leaving on the table.
Test volume discounts. "Buy 2, save 10%" or "Buy 3, save 15%." See if customers are willing to increase order size for an incentive.
Where to look: Filter orders by product. Count how many customers buy one unit vs. multiple units. If 80%+ buy single units of a consumable or giftable product, you've found Signal 3.
See these signals in action. Rohan from Intelligems shares real examples of brands testing shipping rates, bundles, and volume discounts and the surprising results they discovered.
How This Works in Practice
Here's a concrete example. Let's say your top sellers are priced between $100 and $125, and most orders fall between $50 and $200.
Setting a free shipping minimum at $150 gives customers reason to add something to the cart. It's above your hero product prices but within reach. Customers buying a $125 item might add a $30 accessory to hit the threshold.
But if you set it at $200? Too aggressive. Not enough orders above that point today. You'd be asking customers to nearly double their natural cart size. That threshold sits too far above where buying behavior actually clusters.
This is how data informs test design. You're not picking $150 because it's a round number. You're picking it because your order distribution shows natural demand between $100-$200, with hero items at $100-$125.
Think About Your Business Right Now
Do you have these signals in your data?
High abandonment at checkout? Products bought together repeatedly? Single unit purchases when bulk makes sense?
Every business has clues like these. You just need to know where to look. Your clues might be different. Cart abandonment at specific price points. Categories with unusually high or low margins. Products that spike during certain periods.
The opportunities are already there. You're not inventing them. You're discovering them.
What Changes When You Do This
You stop guessing about what to test.
You're not brainstorming in a conference room wondering what might work. You're not copying competitors because "they must know something." You're not testing random ideas hoping one sticks.
You're letting the data show you exactly where to look next. The clues are already in your business. Now you know how to see them.
How to Get Started
Find your biggest opportunity in three steps
Step 1: Pull your four numbers. Traffic, conversion rate, average order size, profit margin. Use Shopify Analytics or your platform's reporting. Get the site-wide numbers first.
(If you're using Intelligems, Sitewide Analytics shows all four in one dashboard. Performance P&L gives you the site-wide view, then Audience Dive breaks them down by device, channel, country, and visitor type.)
Step 2: Break them down. By product. By category. By traffic source if you want to go deeper. Look for patterns. Where is conversion unusually high or low? Where is average order size clustering? Where are margins tightest?
Step 3: Look for signals. The three we covered are common. But your business might show different clues. High abandonment at checkout. Products bought together. Single units when bulk makes sense. Seasonal spikes. Price sensitivity at specific thresholds. Whatever pattern appears most clearly with the most volume.
Step 4: Pick the signal with the most volume. Test where the data is densest. If 500 people abandon at checkout every week but only 50 buy products together, start with Signal 1. More volume means faster, clearer results. Learn more about how to scope your tests effectively.
Step 5: Design your test based on what you found. Signal 1? Test shipping strategy. Signal 2? Test bundles. Signal 3? Test volume discounts. Let the signal tell you what to test.
Step 6: Run for 2-3 weeks. Let patterns stabilize. Different days bring different behavior. Measure profit per visitor, not just conversion or revenue. That's the metric that tells you if the test actually improved your business.
The opportunities are already in your data. You just needed to know where to look.
What Happens After You Find Your Signals?
You've identified your biggest opportunities using data. Now the question becomes: where do you start? Should you test everything at once, or focus on one signal first?
Learn the exact framework for prioritizing your first tests, combining quick wins with bigger swings to build momentum while pursuing meaningful profit improvements.
Ready to find your biggest testing opportunities? When you're ready to stop guessing and start testing what your data shows you, let's get you testing beyond what's typical.
AB Testing
AB Testing
AB Testing


