AB Testing
Dec 23, 2025
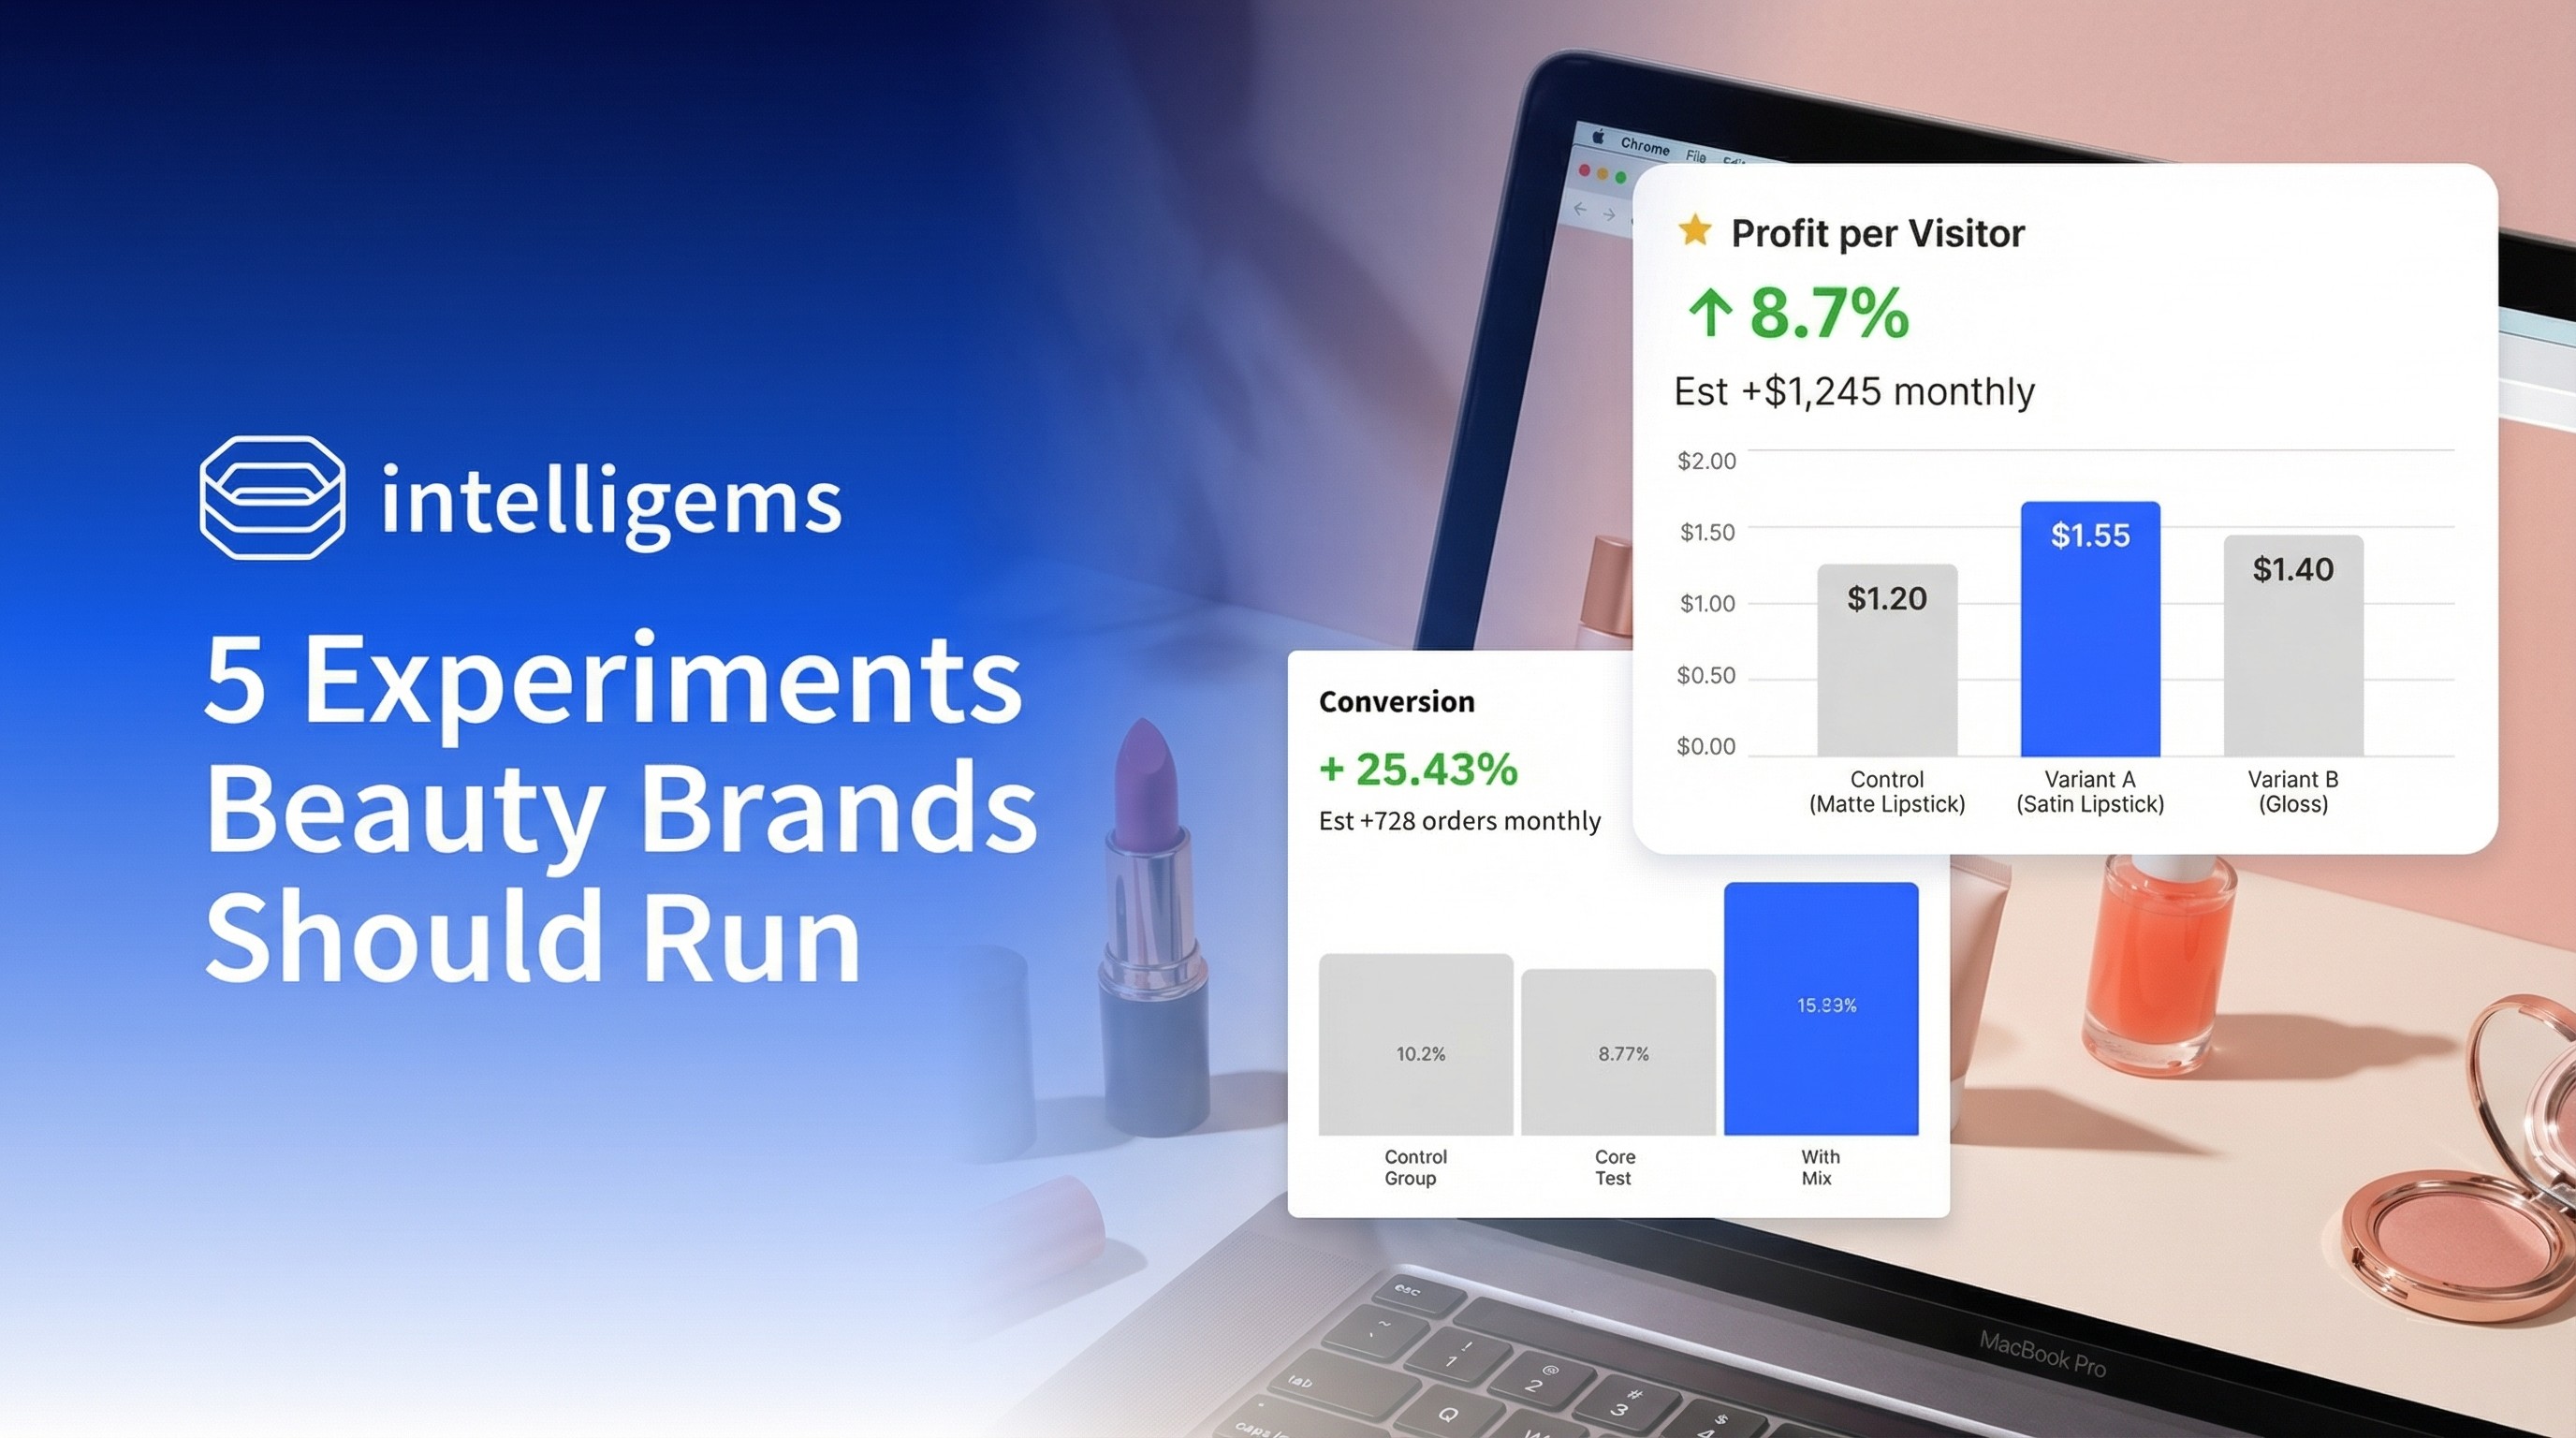
5 Experiments Beauty Brands Should Run
Your customers don't just buy products. They build routines. They discover new favorites. They gift to friends. And they come back when they run out.
Your customers don't just buy products. They build routines. They discover new favorites. They gift to friends. And they come back when they run out.
That's what makes beauty different. Each of these behaviors leaves a signal in your data: patterns that reveal where friction exists and where opportunity hides. The brands that win aren't guessing which promotions might work. They're reading the signals, forming hypotheses, and testing to validate.
Your data already knows what your customers want. The question is whether you're listening. Here are five experiments designed specifically for beauty brands, each starting with a signal you might already be seeing.
Are Customers Building Routines Without You?
If they're buying complementary products separately, bundle them
Look at your order data. Are customers purchasing cleanser in January, then serum in February, then moisturizer in March? That's a signal: they're building a routine, but you're making them do the work.
The signal: Customers buying complementary products across multiple orders within 60-90 days.
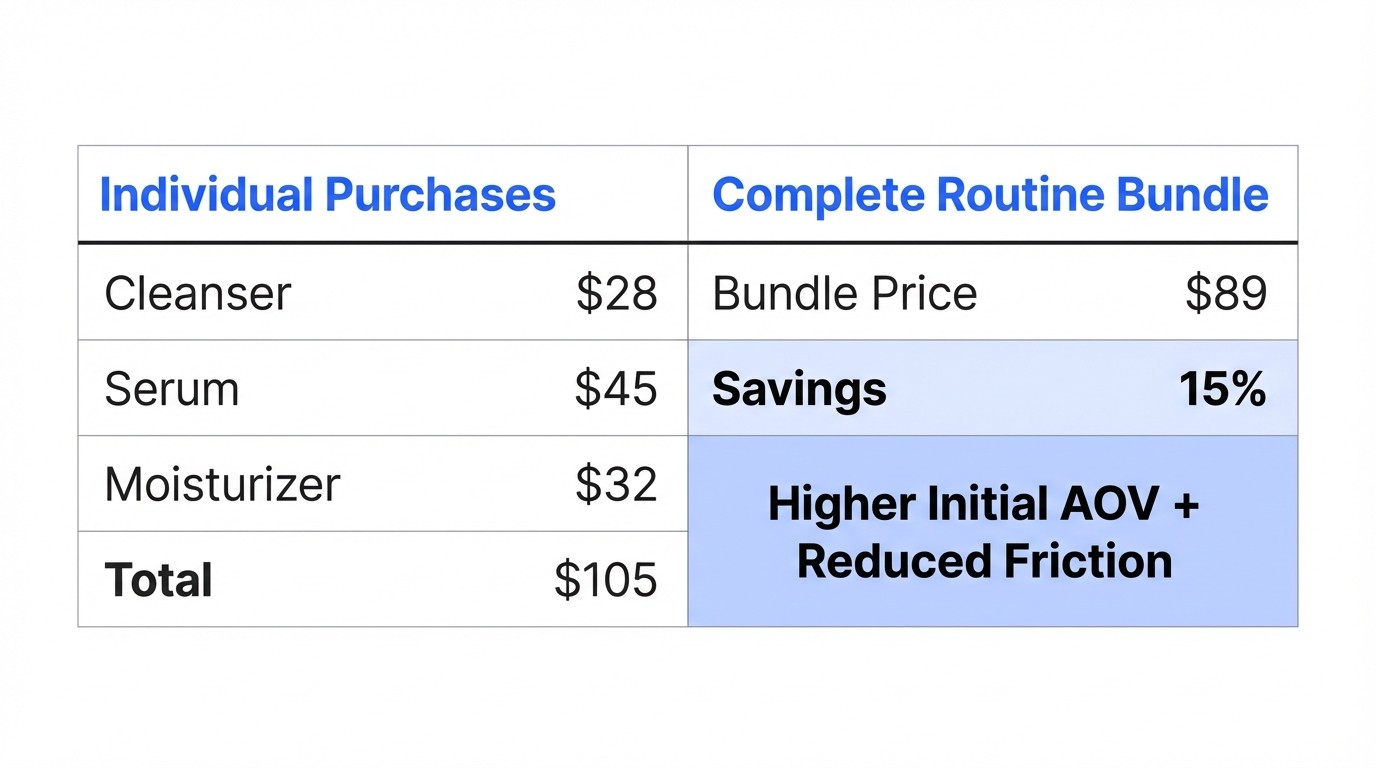
The hypothesis: A routine bundle at a modest discount will increase initial order value while reducing friction for customers who would have bought these items anyway.
The test: Create a "Complete Routine" bundle featuring your most commonly co-purchased products. Test the bundle price against buying items individually. Start with your top 3-5 product combinations based on actual purchase patterns.
The measure: Track profit per visitor, not just average order value. The bundle might increase AOV but compress margins. Only profit per visitor tells you if you're winning. Understand your margin thresholds before testing.
Is Gifting Behavior Hiding in Your Seasonal Data?
Seasonal spikes reveal gifting opportunities
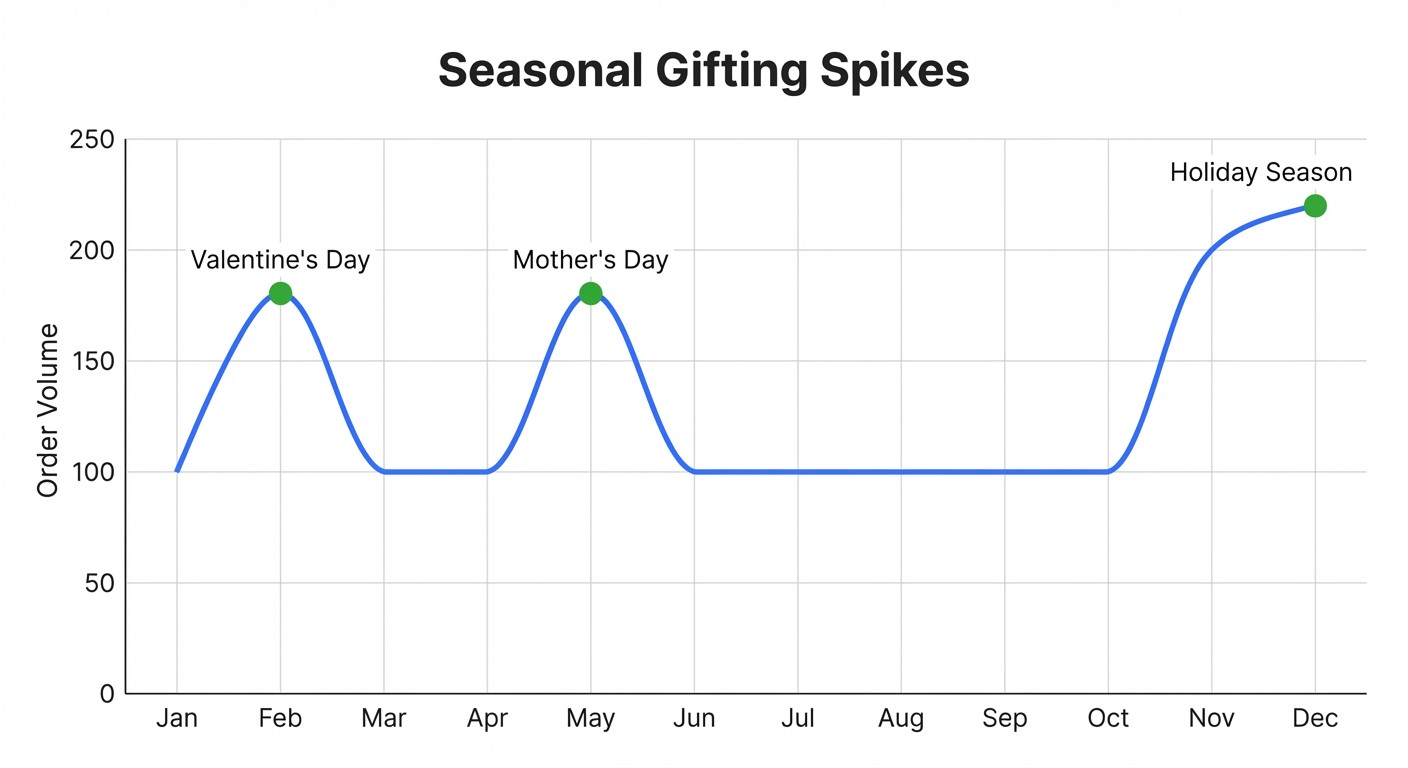
Pull your order reports from the past year. Do you see sharp increases around holidays, Mother's Day, or Valentine's Day? That's not just seasonal demand. That's gifting behavior.
The signal: Traffic and conversion spikes during traditional gifting periods, plus higher-than-average orders with gift messaging enabled.
The hypothesis: A curated gift set with perceived value higher than its component cost will outperform individual product purchases during these windows.
The test: Create a gift set that costs you less than customers perceive it's worth. A $5 item that feels worth $25 creates powerful arbitrage. Test the gift set against your standard product offerings during a non-peak period first, then optimize before the next seasonal window.
The measure: Compare profit per visitor for gift set purchasers versus individual product purchasers. Factor in packaging costs. A beautiful unboxing experience costs money but might drive significantly higher conversion.
Are New Products Stalling at the Cart?
High browse-to-cart but low cart-to-purchase signals risk aversion
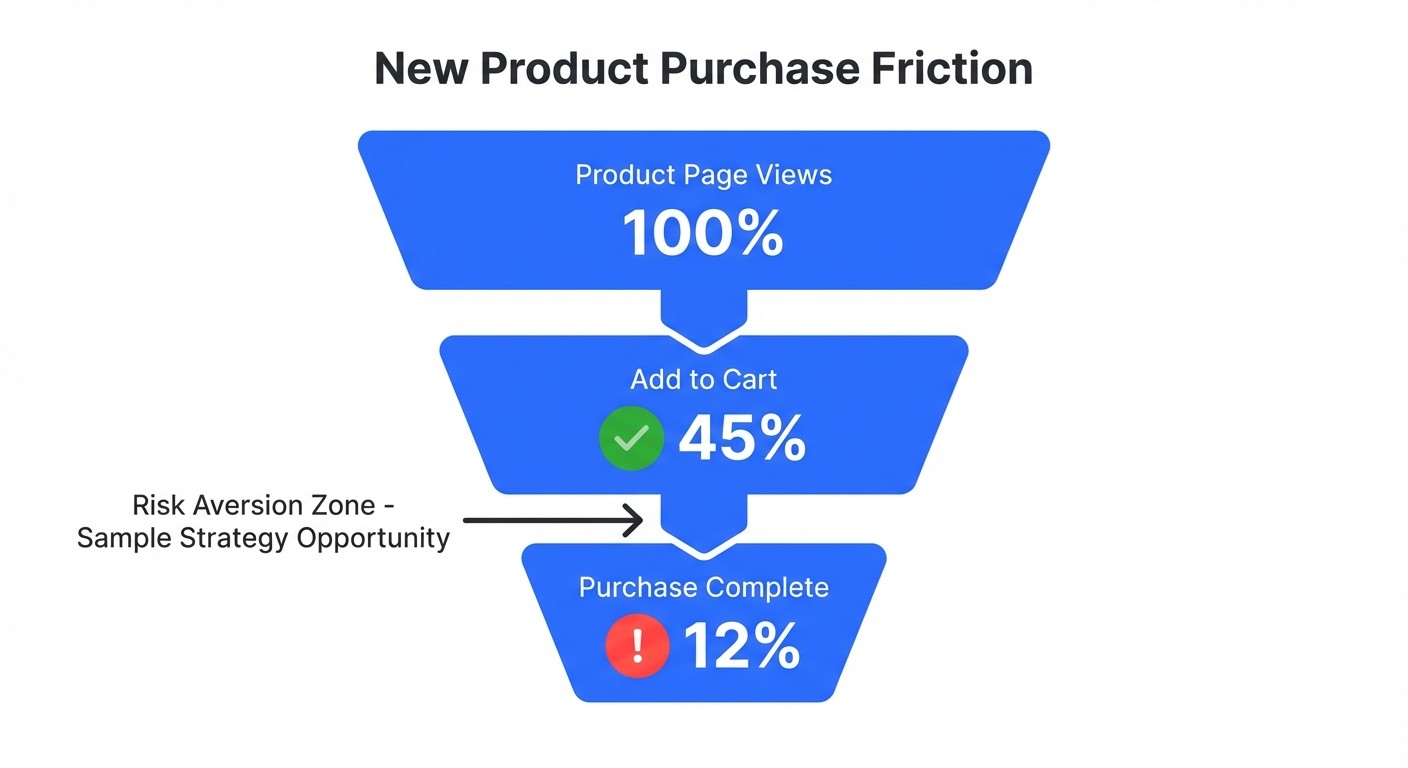
You launched a new serum. Customers are adding it to cart. But then they abandon. That pattern tells you something specific: interest is high, but commitment is scary. Understanding why customers abandon at checkout is the first step to fixing it.
The signal: New products with high product page engagement and add-to-cart rates, but significantly lower cart-to-purchase conversion than your established products.
The hypothesis: Customers want to try before they commit. A sample or travel size reduces perceived risk and creates a path to full-size purchase.
The test: Offer a sample size or discovery kit for new products. Test whether sample purchasers convert to full-size at rates that justify the sample program's costs. Track the full customer journey, not just the initial sample purchase.
The measure: Calculate customer lifetime value for sample purchasers versus those who buy full-size immediately. If sample buyers convert and repurchase at high rates, the program pays for itself.
Do Your Customers Reorder Like Clockwork?
Predictable reorder cycles are pricing opportunities
Some products run out. Shampoo, moisturizer, foundation: customers know when they'll need more. If your data shows consistent reorder intervals, you're sitting on a subscription or replenishment opportunity.
The signal: Repeat purchases of the same product at predictable intervals (30, 60, or 90 days).
The hypothesis: A replenishment discount or subscription offer will lock in revenue and increase lifetime value without training customers to wait for sales.
The test: Test different discount depths for replenishment: 5% versus 10% versus 15%. See which depth maximizes subscription sign-ups while preserving margin. Also test subscribe-and-save messaging against one-time replenishment reminders. For technical implementation, learn how to set up a price test.
The measure: Track profit per visitor across the full customer relationship, not just the first order. A 10% discount that doubles retention might dramatically increase total customer value even with lower per-order margins.
Learn how pre-selecting subscriptions can boost both conversion and subscription take rates, plus why measuring LTV after 60-90 days reveals the true story of your replenishment strategy.
Are Discounts Creating Loyal Customers or Discount Addicts?
High repeat rate plus high discount dependency is a warning sign
You want repeat customers. But not at any cost. If your repeat customers only buy during sales, your discounts might be training behavior rather than rewarding loyalty.
The signal: High repeat purchase rate, but those purchases cluster around promotional periods. Full-price purchase rate among repeat customers is declining.
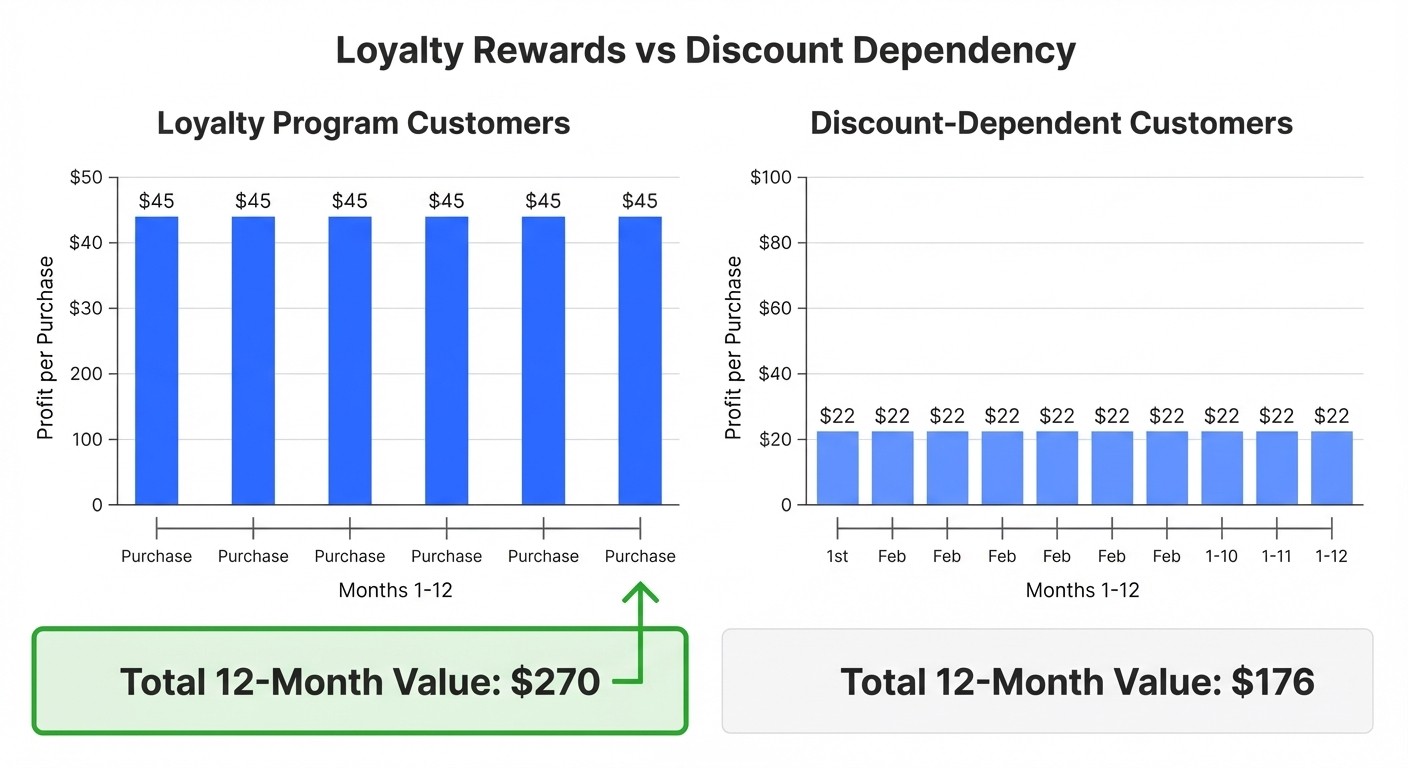
The hypothesis: Loyalty rewards based on purchase history (not discount codes) will maintain repeat behavior while reducing discount dependency.
The test: Segment your repeat customers. Test early access to new products, exclusive gifts, or points-based rewards against percentage discounts. See which approach maintains repeat purchase rate while improving profit per transaction.
The measure: Compare profit per visitor for loyalty-rewarded customers versus discount-dependent customers over 6-12 months. The discount group might buy more frequently but at margins that make them less valuable than you thought.
Stop Guessing. Start Knowing.
Beauty brands have unique advantages: routines create predictability, gifting creates seasonal spikes, and replenishment creates recurring revenue. But these advantages only matter if you're testing to optimize them.
Every experiment starts with a signal in your data. Every signal suggests a hypothesis. Every hypothesis deserves a test. And every test should measure what actually matters: profit per visitor. To see the full picture, you need to understand your experiment analytics and track true profitability.
Discover why cost of goods sold (COGS) data is essential for beauty brands running price, shipping, or offer tests, and how profit per visitor reveals what revenue metrics miss.
Start with your data signals:
Look for routine-building behavior across orders
Identify seasonal gifting patterns
Find new product hesitation in cart abandonment
Map replenishment cycles for consumable products
Separate loyal customers from discount-dependent ones
Don't guess which experiments will move the needle for your beauty brand. Know.
Ready to discover what experiments will move the needle for your beauty brand? When you're ready to let your data guide your testing, let's get you testing beyond what's typical.
AB Testing
AB Testing
AB Testing


