AB Testing
Feb 3, 2026
5 Experiments Food and Snack Brands Should Run
Why perishability is your biggest challenge and your biggest advantage

Food and snack brands face a challenge other categories don't. Your products have an expiration date. Customers worry about freshness, portion sizes, and whether they'll actually eat what they order before it goes stale.
This creates friction that a tech gadget or clothing brand never has to think about. But it also creates opportunity. The brands that figure out how to reduce that friction, how to make trying new products feel safe, end up building the kind of loyalty that's hard to break.
What follows aren't universal prescriptions. They're data signals that often reveal opportunities specific to food and snack brands. Your numbers will tell you which ones are worth investigating.
1. Sample or Trial Size for New Customers
Experimenting with subscriptions: How to test whether subscription models fit your customer behavior.
Your data signal: Low first-order conversion but high repeat rate
If you're seeing strong repeat purchase rates but struggle to get that first order, this pattern is telling you something. Customers who try your product come back. The barrier isn't quality. It's the initial commitment. This is a classic conversion rate challenge.
This often points to first-order risk aversion. A full-size bag of something unfamiliar feels like a gamble. What if they don't like it? What if it sits in the pantry until it's stale? A trial size option could shift that math. Whether it works for your specific products depends on your margin structure and customer behavior.
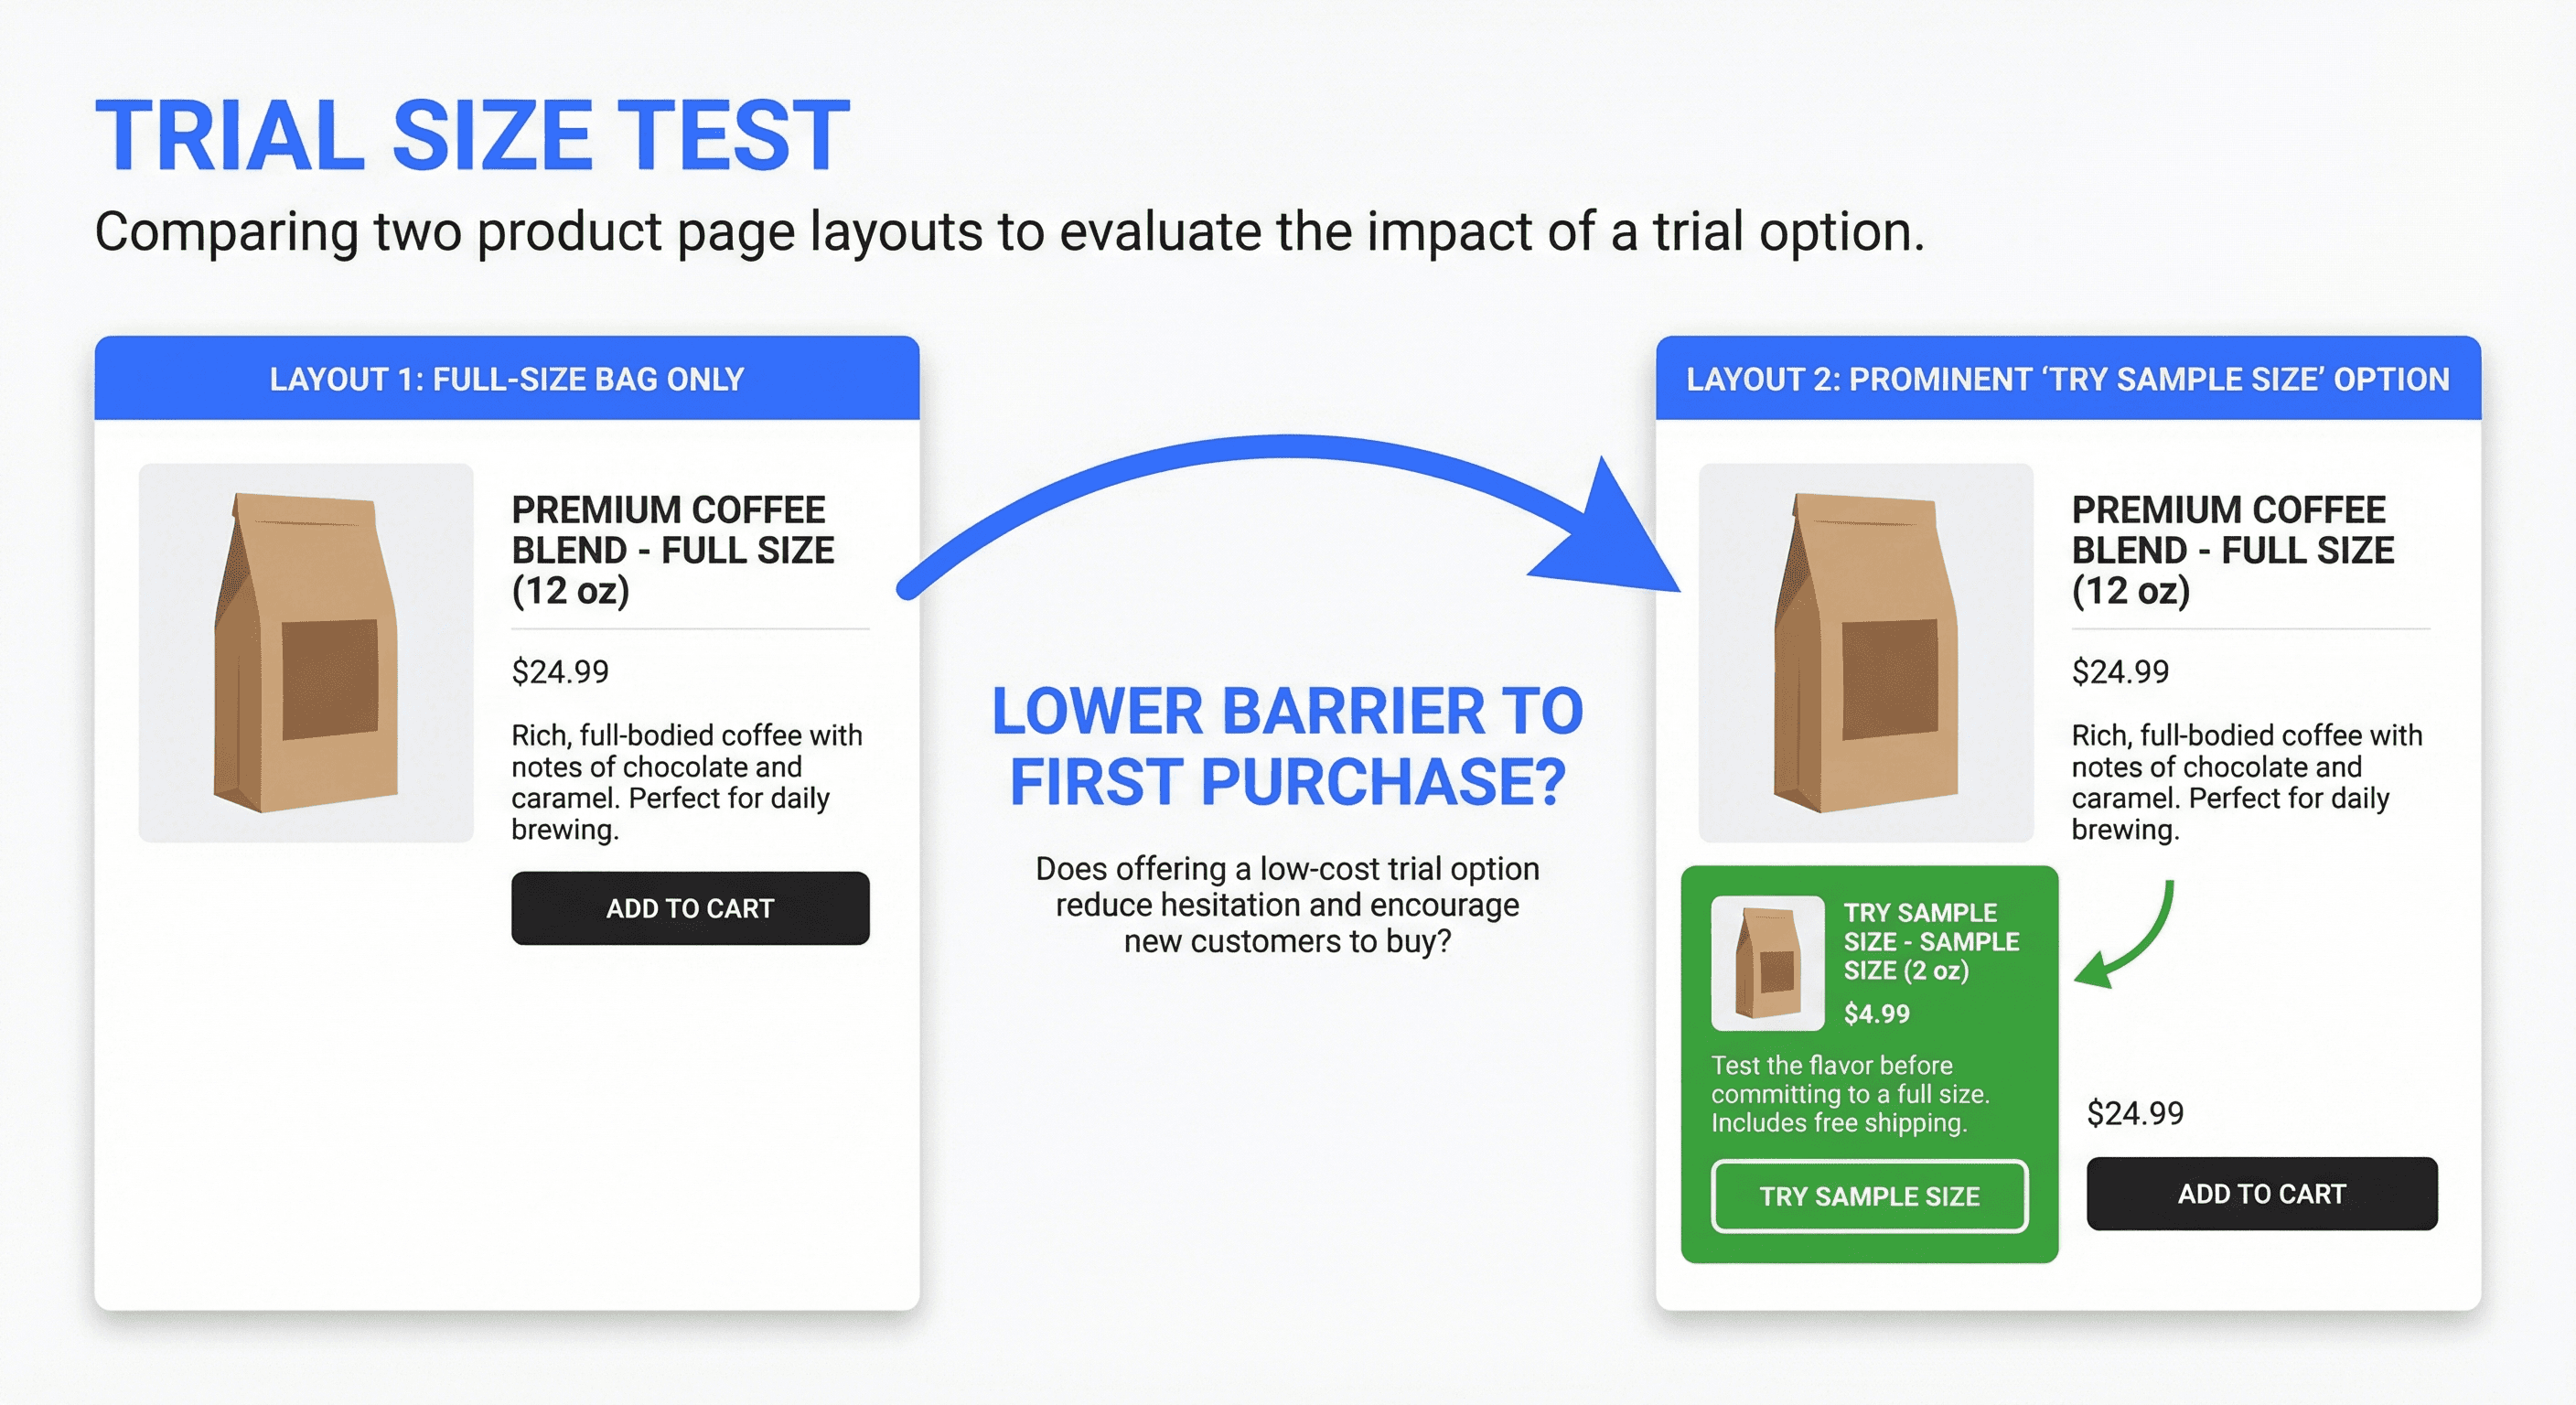
What you might explore: Trial size option prominently featured vs full-size only on product pages
Track this to understand: Profit per visitor, second order rate, customer acquisition cost
2. Subscription Frequency Options
Your data signal: Reorder intervals vary widely among customers
If your reorder data shows some customers coming back in two weeks and others in six, that variance is worth investigating. A monthly subscription makes sense for some foods. But snacking habits aren't uniform. Getting subscription pricing right requires flexibility.
This pattern could indicate that rigid subscription timing doesn't match how different households actually consume. One-size-fits-all frequency forces customers into a rhythm that might not fit. More flexibility could mean more retention, but the right approach depends on what your specific data shows.
What you might explore: Weekly vs bi-weekly vs monthly subscription frequency options
Track this to understand: Profit per visitor, subscription retention at 90 days, cancellation reasons
3. Bundle vs Individual Products First Purchase
Your data signal: Customers who try one product then expand to others
If you're seeing a pattern where customers start with one SKU, fall in love, then gradually explore your catalog over multiple orders, that's a discovery journey worth examining.
This could indicate an opportunity to compress that exploration. Instead of five orders over six months to find three favorites, a starter bundle might help them find them all in order one. Bundles are a proven way to increase AOV. Whether bundling increases overall value depends on your product mix and how customers respond to curated options.
What you might explore: Starter bundle prominently featured vs individual SKUs as the main browsing experience
Track this to understand: Profit per visitor, product adoption breadth, second order variety
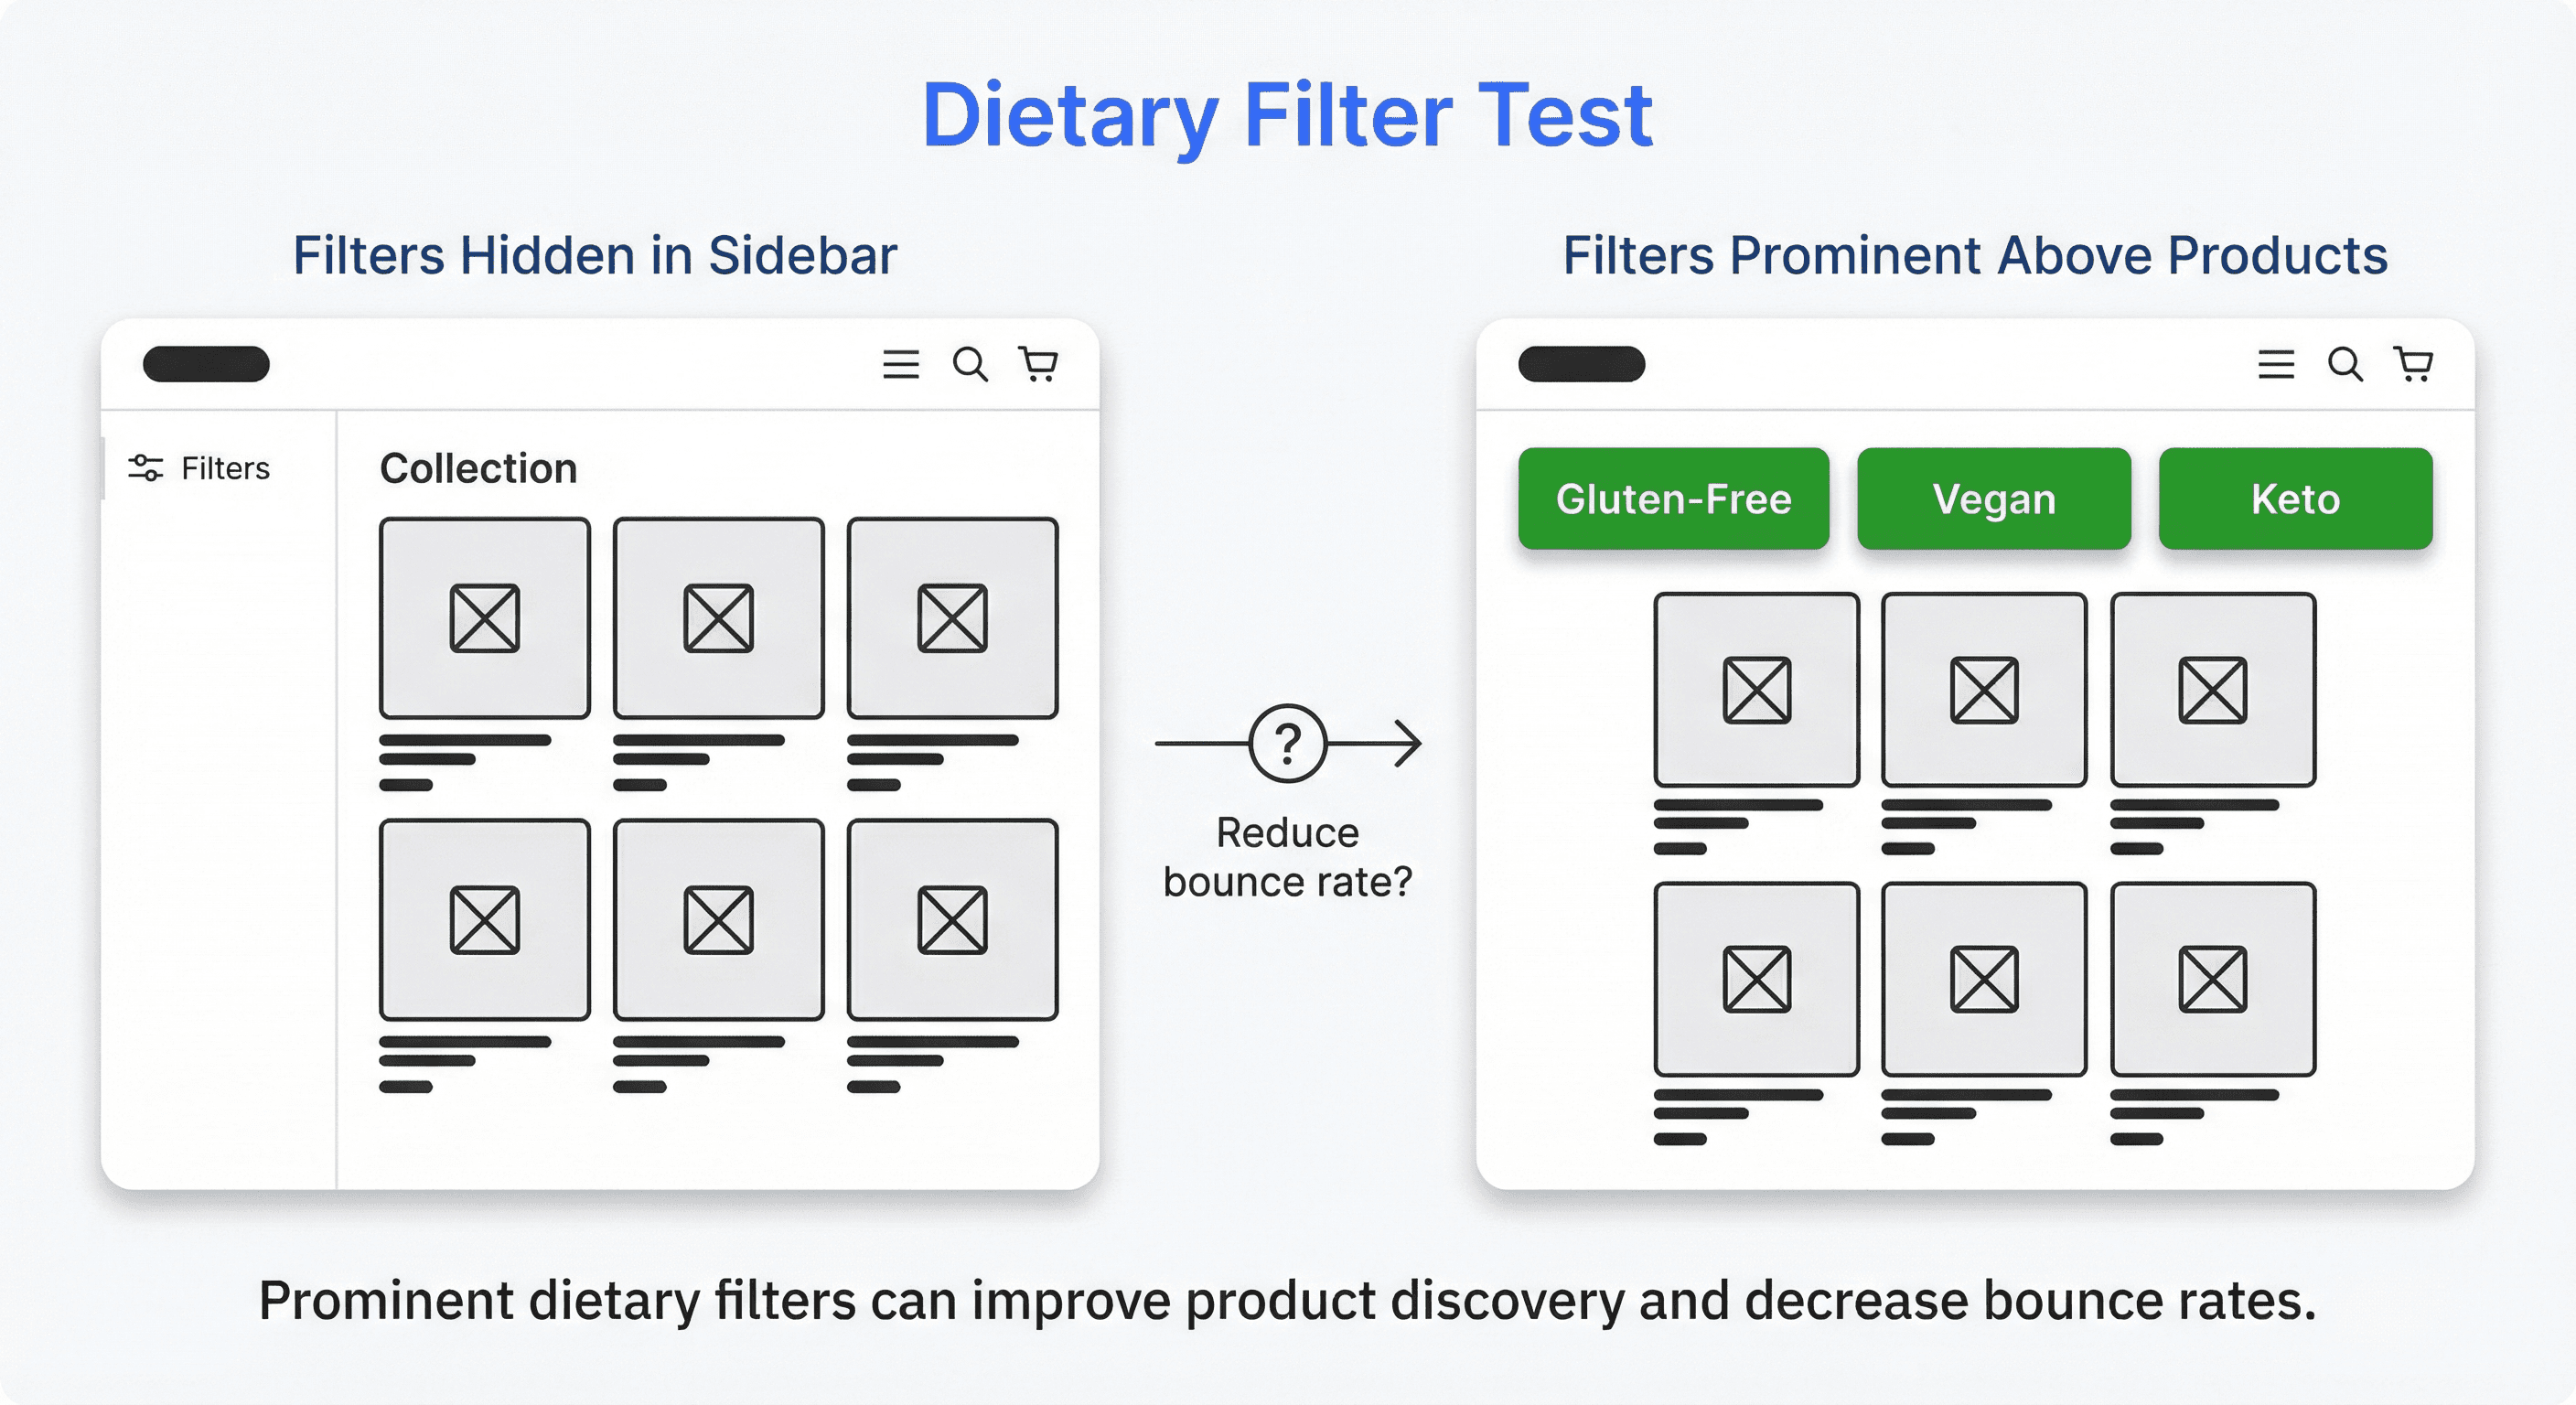
4. Dietary Filter Prominence
Your data signal: Bounce rate on collection pages
If your collection page bounce rate is high, that's worth investigating. Customers with dietary restrictions have learned to scan fast. Gluten-free? Vegan? Keto? If they can't find what they're looking for in seconds, they're gone.
This pattern often points to a navigation issue rather than a product issue. The friction might not be what you sell. It might be how hard you're making it to filter down to what actually works for each customer. Testing filter visibility using content testing could reveal whether that's the case.
What you might explore: Dietary filters above the fold vs filters in sidebar or hidden behind a button
Track this to understand: Profit per visitor, pages per session, time to first add-to-cart
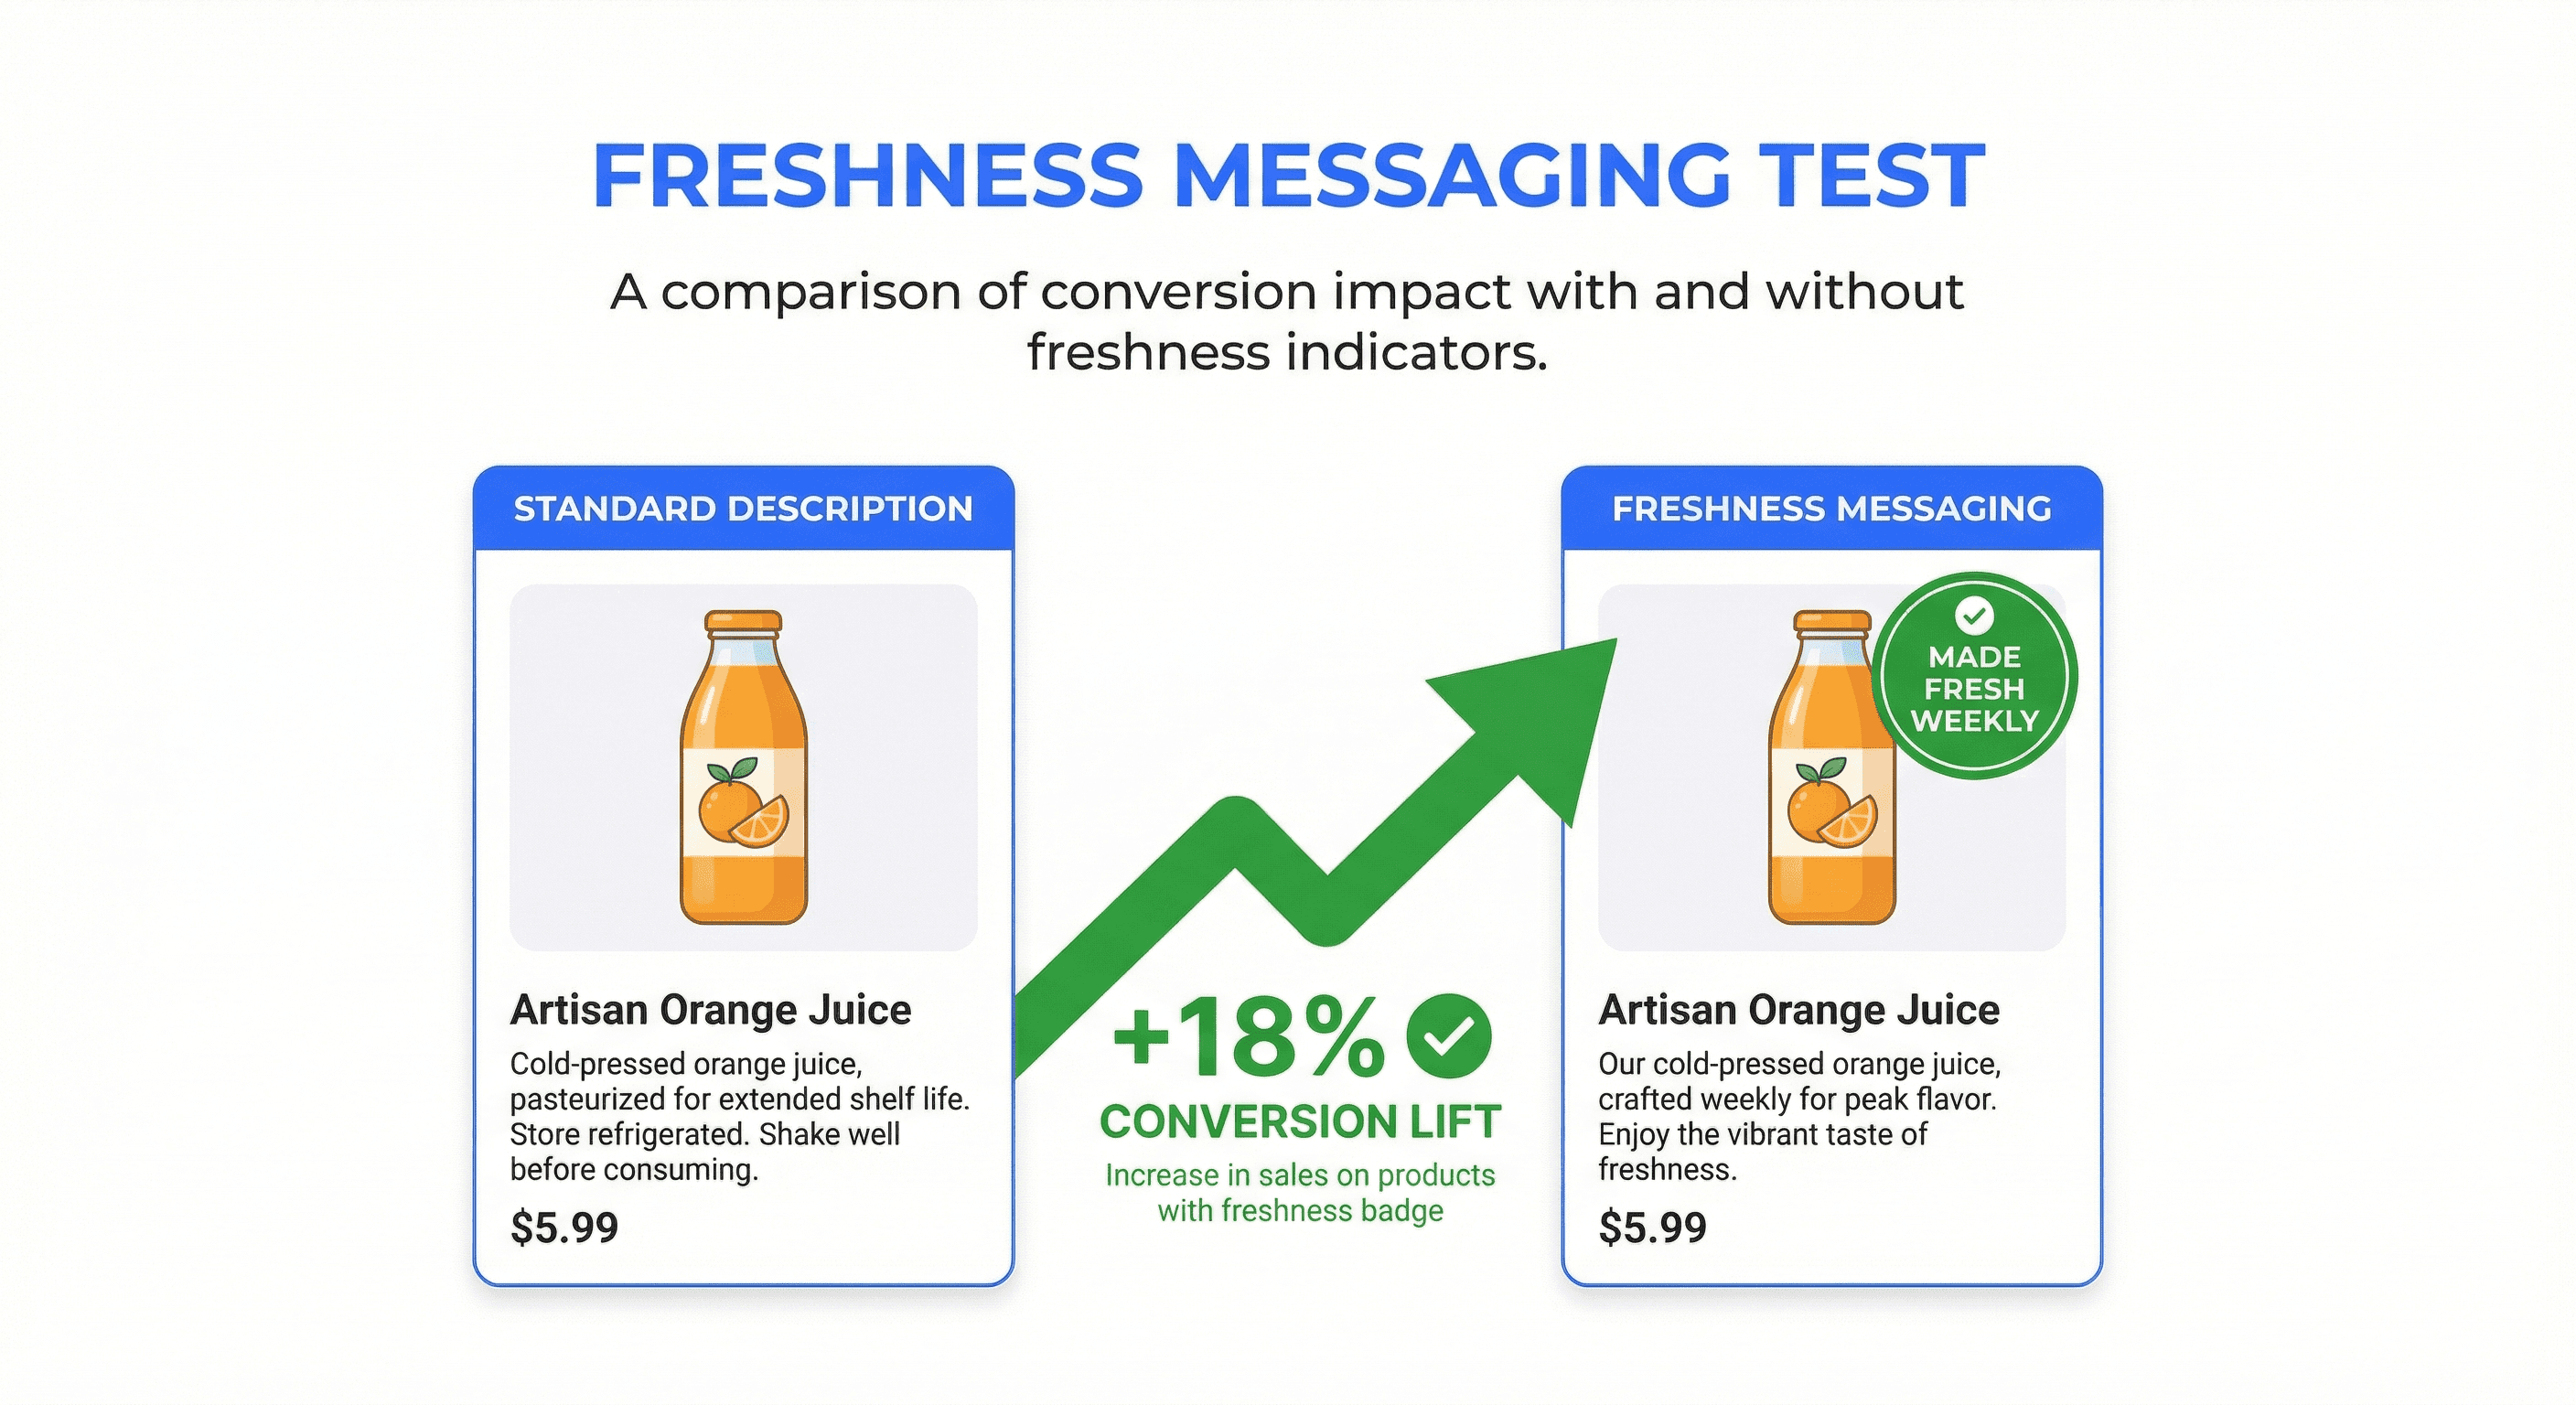
5. Freshness Guarantee Messaging
Your data signal: Cart abandonment on perishable items
If you're seeing higher cart abandonment on items with shorter shelf life, that pattern reveals something about customer anxiety. People worry about buying food online. Will it arrive stale? Will it sit in a hot delivery truck?
This could indicate an opportunity to address that anxiety directly. A freshness guarantee takes a different approach than emphasizing fast shipping. Which message moves the needle depends on what your specific customers are worried about. Your abandonment data by product type can guide where to investigate.
What you might explore: Freshness guarantee badge prominent vs shipping speed emphasis vs both
Track this to understand: Profit per visitor, conversion rate on perishable items, cart abandonment rate
Your Data Points the Way
These signals are starting points, not a checklist. The experiments worth running for your brand depend on what your own data is telling you.
If repeat rates are strong but first orders lag, trial sizes might lower the barrier
If reorder intervals vary widely, flexible subscription options could improve retention
If customers discover your catalog slowly, bundles might accelerate that journey
If collection page bounces are high, filter visibility might be the friction point
If perishable items see more abandonment, freshness messaging could address the anxiety
Your data tells you what to test. Start there.
Ecommerce Strategy
Content Testing
AB Testing


