AB Testing
Jan 8, 2026
5 Experiments High-Ticket Brands Should Run
The impulse-purchase playbook won't work here. Your customers are researching, comparing, and deliberating.

When you're selling a $2,000 mattress or an $800 jacket, everything changes. The customer journey stretches from hours to weeks. Every friction point gets magnified. And the decisions that seem minor for a $30 purchase become make-or-break moments for high-ticket conversions.
But applying the same optimization playbook designed for impulse purchases won't work here. Your customers aren't impulse buying. They're researching, comparing, and deliberating. They're scrutinizing your shipping policy, questioning whether payment plans exist, and wondering if that premium price actually reflects premium quality.
The good news? Your data already contains signals pointing to exactly where these friction points live. The question isn't whether opportunities exist. It's whether you're reading the signals correctly and running the right experiments to capture them. Let's look at five experiments every high-ticket brand should consider, each starting with the data signal that tells you it's time to test.
Is Your Shipping Cost Creating Sticker Shock?
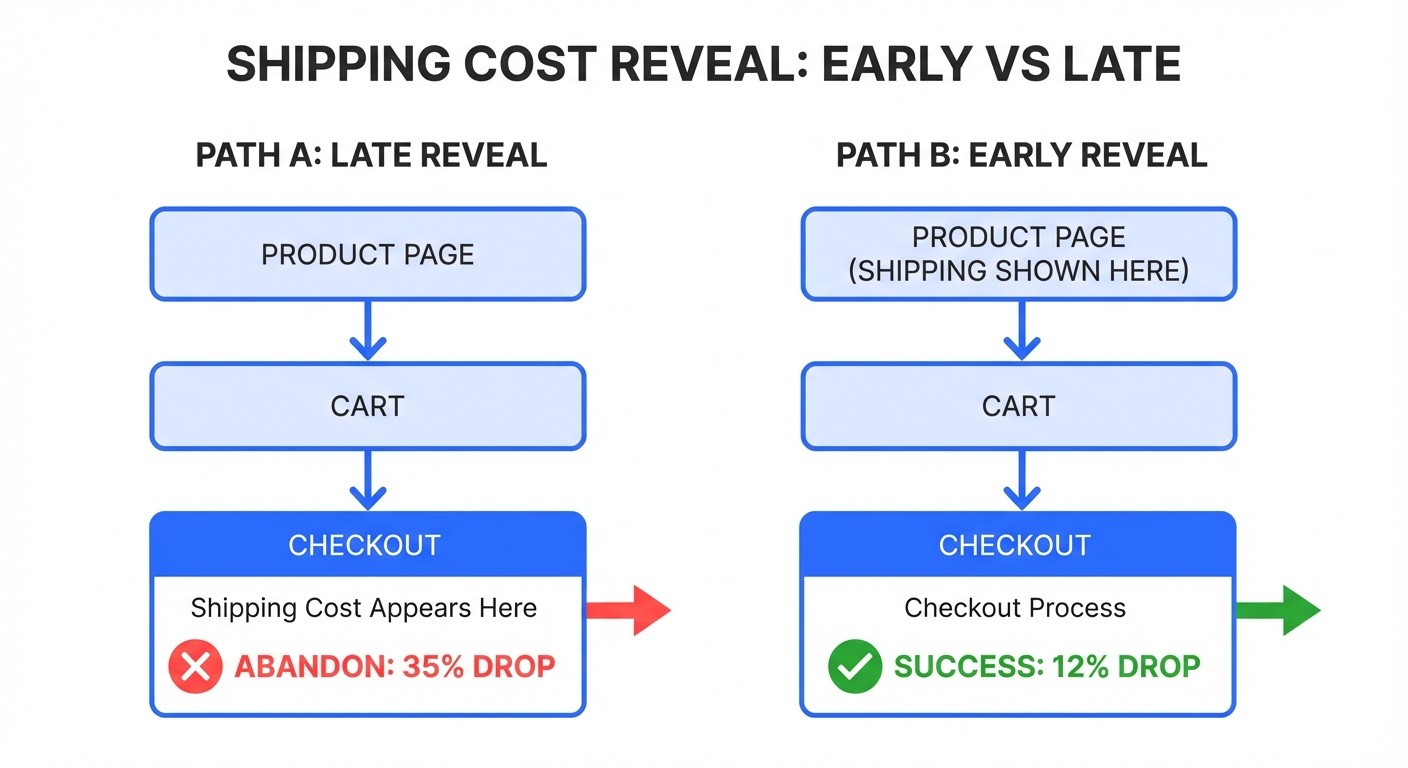
Your data signal: Cart abandonment rates spike specifically at the checkout stage where shipping costs appear.
When customers invest significant time configuring a $1,500 furniture piece only to abandon at checkout, shipping visibility is often the culprit. This pattern becomes especially clear when you compare abandonment rates between customers who saw shipping estimates early versus those who encountered them for the first time at checkout.
The hypothesis: For high-ticket purchases, customers mentally budget for the product but treat shipping as an unexpected add-on. Revealing shipping costs earlier (or absorbing them into product pricing) reduces the psychological friction of "surprise fees."
The test: Run an A/B test comparing your current checkout flow against a variant where shipping costs appear on the product page or cart page. Alternatively, test bundled pricing where shipping is "free" but built into the product price. The key is understanding how much you can actually charge for shipping before it becomes a conversion killer. You might also consider testing different free shipping thresholds to find the sweet spot. For step-by-step guidance, learn how to set up a shipping test.
The measure: Track profit per visitor across both variants. Higher-ticket items can often absorb shipping costs while maintaining margins. The question is whether doing so lifts conversion enough to improve overall profitability.
Discover how one brand tested charging for previously free shipping and saw both conversion rate increase by 3.6% and profit per visitor jump by 10%, proving that the right shipping rate can actually boost sales.
Are Customers Interested But Unable to Commit?
Your data signal: High time-on-page and strong product engagement metrics, but conversion rates that don't match the interest level, particularly on your most expensive SKUs.
This pattern often indicates payment friction rather than product friction. When someone spends eight minutes exploring a $1,200 product, reads every review, and then leaves without purchasing, the barrier frequently isn't desire. It's budget timing. This is a common driver of checkout abandonment for premium products.
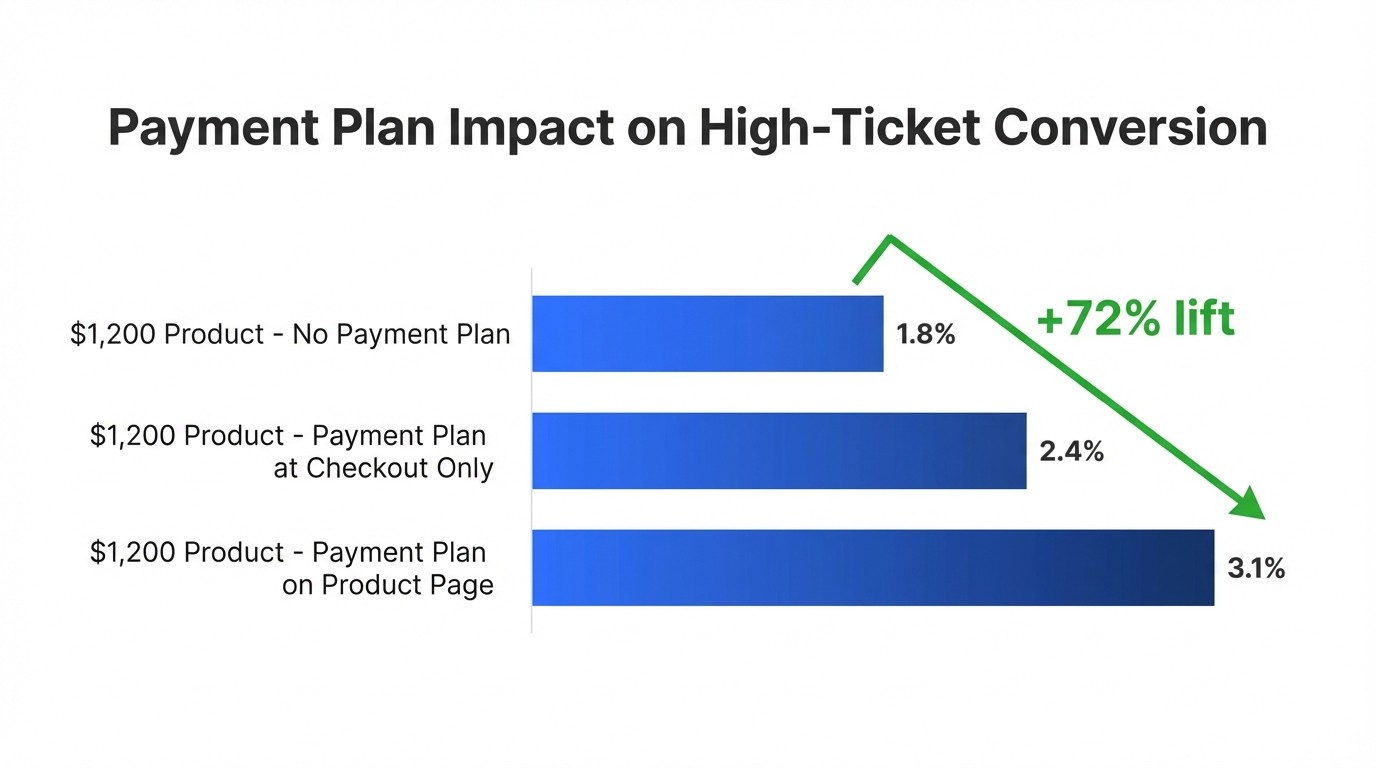
The hypothesis: Customers want your high-ticket products but can't justify the full payment today. Offering structured payment plans removes the timing barrier while maintaining full price integrity.
The test: Implement payment plan options (Affirm, Klarna, or shop-native installments) and test whether their presence lifts conversion on your highest-priced items. Consider testing placement as well: does showing payment plan messaging in the product description outperform showing it only at checkout?
The measure: Calculate profit per visitor for customers who encounter payment plan options versus those who don't. Factor in any payment plan fees and monitor whether average order values shift. Some brands find customers actually spend more when payment friction disappears.
Does Your Delivery Experience Match Your Product Quality?
Your data signal: Customer service inquiries frequently mention delivery concerns, or return reasons cite damage, disappointment with unboxing, or "not what I expected."
For high-ticket items, the delivery experience is an extension of the product experience. When Shopify analytics and customer feedback reveal delivery-related friction, you're looking at an opportunity to turn logistics into a differentiator.
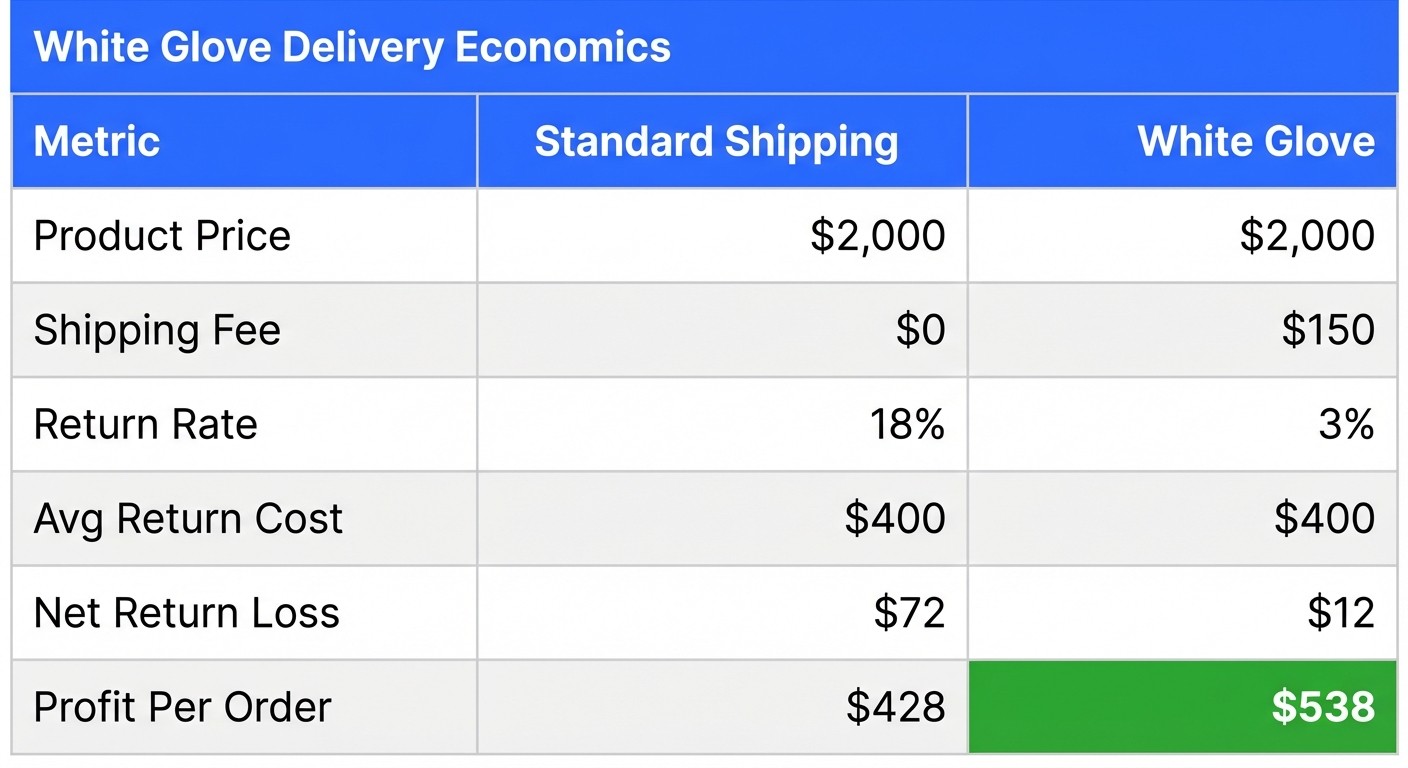
The hypothesis: Customers purchasing premium products expect premium handling. White glove delivery options (scheduled delivery, in-home setup, packaging removal) can reduce returns, increase satisfaction, and potentially command a premium that improves margins.
The test: Offer a white glove delivery upgrade at checkout for your highest-ticket items. Test different price points for the service. Monitor whether customers who select white glove delivery have lower return rates and higher satisfaction scores.
The measure: Compare profit per visitor between customers who received standard shipping versus white glove options. Include return rate differentials in your calculation. A $150 white glove fee that reduces returns by 15% on a $2,000 product can dramatically improve unit economics.
Are Customers Not Discovering Your Best Products?
Your data signal: Low conversion on entry-point products, high browse-to-exit rates, and customers not progressing to view your hero products.
Sometimes the path to your premium offerings is blocked by the absence of an accessible entry point. This becomes visible when analytics show customers landing, browsing briefly, and leaving without ever discovering your flagship products. The loss leader strategy addresses exactly this problem.
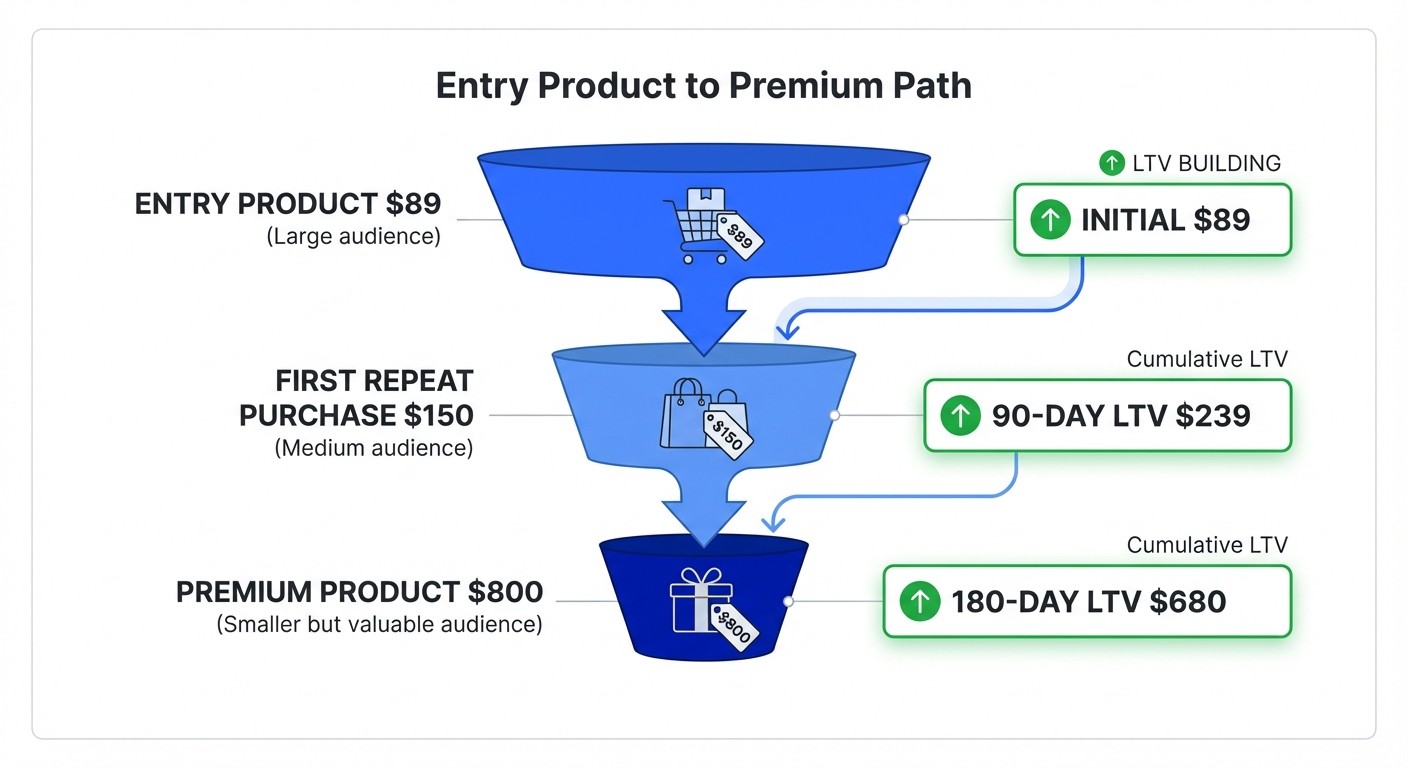
The hypothesis: A strategically priced entry product (even at reduced margin) creates customer acquisition momentum that leads to higher-margin purchases over time. The goal isn't profit on the first transaction. It's lifetime value creation.
The test: Identify or create an entry-point product priced significantly below your core range. Test aggressive pricing or promotional positioning for this product while tracking whether purchasers return to buy from your premium range.
The measure: Extend your profit per visitor calculation beyond the initial transaction. Track 90-day and 180-day customer value for those who entered through the loss leader versus those who purchased full-price items first. The entry-point strategy only works if customer lifetime value justifies the margin sacrifice.
Are You Leaving Premium Positioning on the Table?
Your data signal: Strong brand perception metrics, high customer satisfaction scores, and repeat purchase rates, but pricing that mirrors competitors rather than reflecting your differentiated value.
This is the inverse problem: brands with legitimate premium positioning who price as though they're commodities. The signal often appears in qualitative data: customers mentioning quality exceeds expectations, unsolicited comparisons to more expensive alternatives, or willingness to recommend without price caveats.
The hypothesis: Your brand has earned the right to premium pricing, but you're leaving margin on the table by pricing conservatively. Testing higher prices on segments of your audience will reveal true price elasticity without hurting overall sales.
The test: Run a controlled price test on a subset of traffic. Start with 5-10% increases on products where you have the strongest brand differentiation. The key question isn't whether some customers will balk. It's whether your prices are actually right for your positioning. For implementation details, review the experimentation best practices.
The measure: Profit per visitor is your North Star here. A 10% price increase that reduces conversion by 5% still improves profitability significantly. The experiment validates whether your brand equity translates to pricing power.
Learn the fundamentals of price testing, including the 5-10% straddle approach for finding optimal pricing and why profit per visitor should be your north star metric for high-ticket products.
Stop Guessing. Start Knowing.
High-ticket brands operate in a different reality than their lower-priced competitors. The consideration cycle is longer. The stakes are higher. And the opportunities hidden in your data are often more valuable.
These five experiments share a common philosophy:
Read the signals your data is already sending
Form hypotheses about what friction or opportunity those signals reveal
Design controlled tests that validate or invalidate your assumptions
Measure profit per visitor as your ultimate success metric
The experiments that move the needle for your brand depend entirely on what your specific data reveals. Shipping sensitivity might be your biggest opportunity. Or payment friction. Or premium pricing confidence. The data knows. Your job is to ask the right questions.
Ready to discover what experiments will move the needle for your high-ticket brand? When you're ready to let your data guide your testing, let's get you testing beyond what's typical.
AB Testing
AB Testing
AB Testing


