Analytics
Nov 7, 2025
NEW: Introducing Intelligems Sitewide Analytics
We built Sitewide Analytics to replace the disconnected dashboards and manual exports you've been piecing together

Today, we're introducing Sitewide Analytics. You've always relied on Shopify Analytics for orders and GA4 for traffic, but neither shows you the metric that actually matters: profit. Not anymore.
We built Sitewide Analytics to replace the disconnected dashboards and manual exports you've been piecing together. It's a profit-first analytics hub that shows you both what happened (store-level results) and who drove it (audience-level insights) in one place.
With Sitewide Analytics, merchants can finally see which channels, devices, and audiences actually drive profit per visitor, not just traffic or revenue.
What Can I See? What Can I Track?
Sitewide Analytics gives you two core views that answer the questions you've been manually building spreadsheets to solve.
The Building Blocks
Sitewide Analytics is built around two pages:
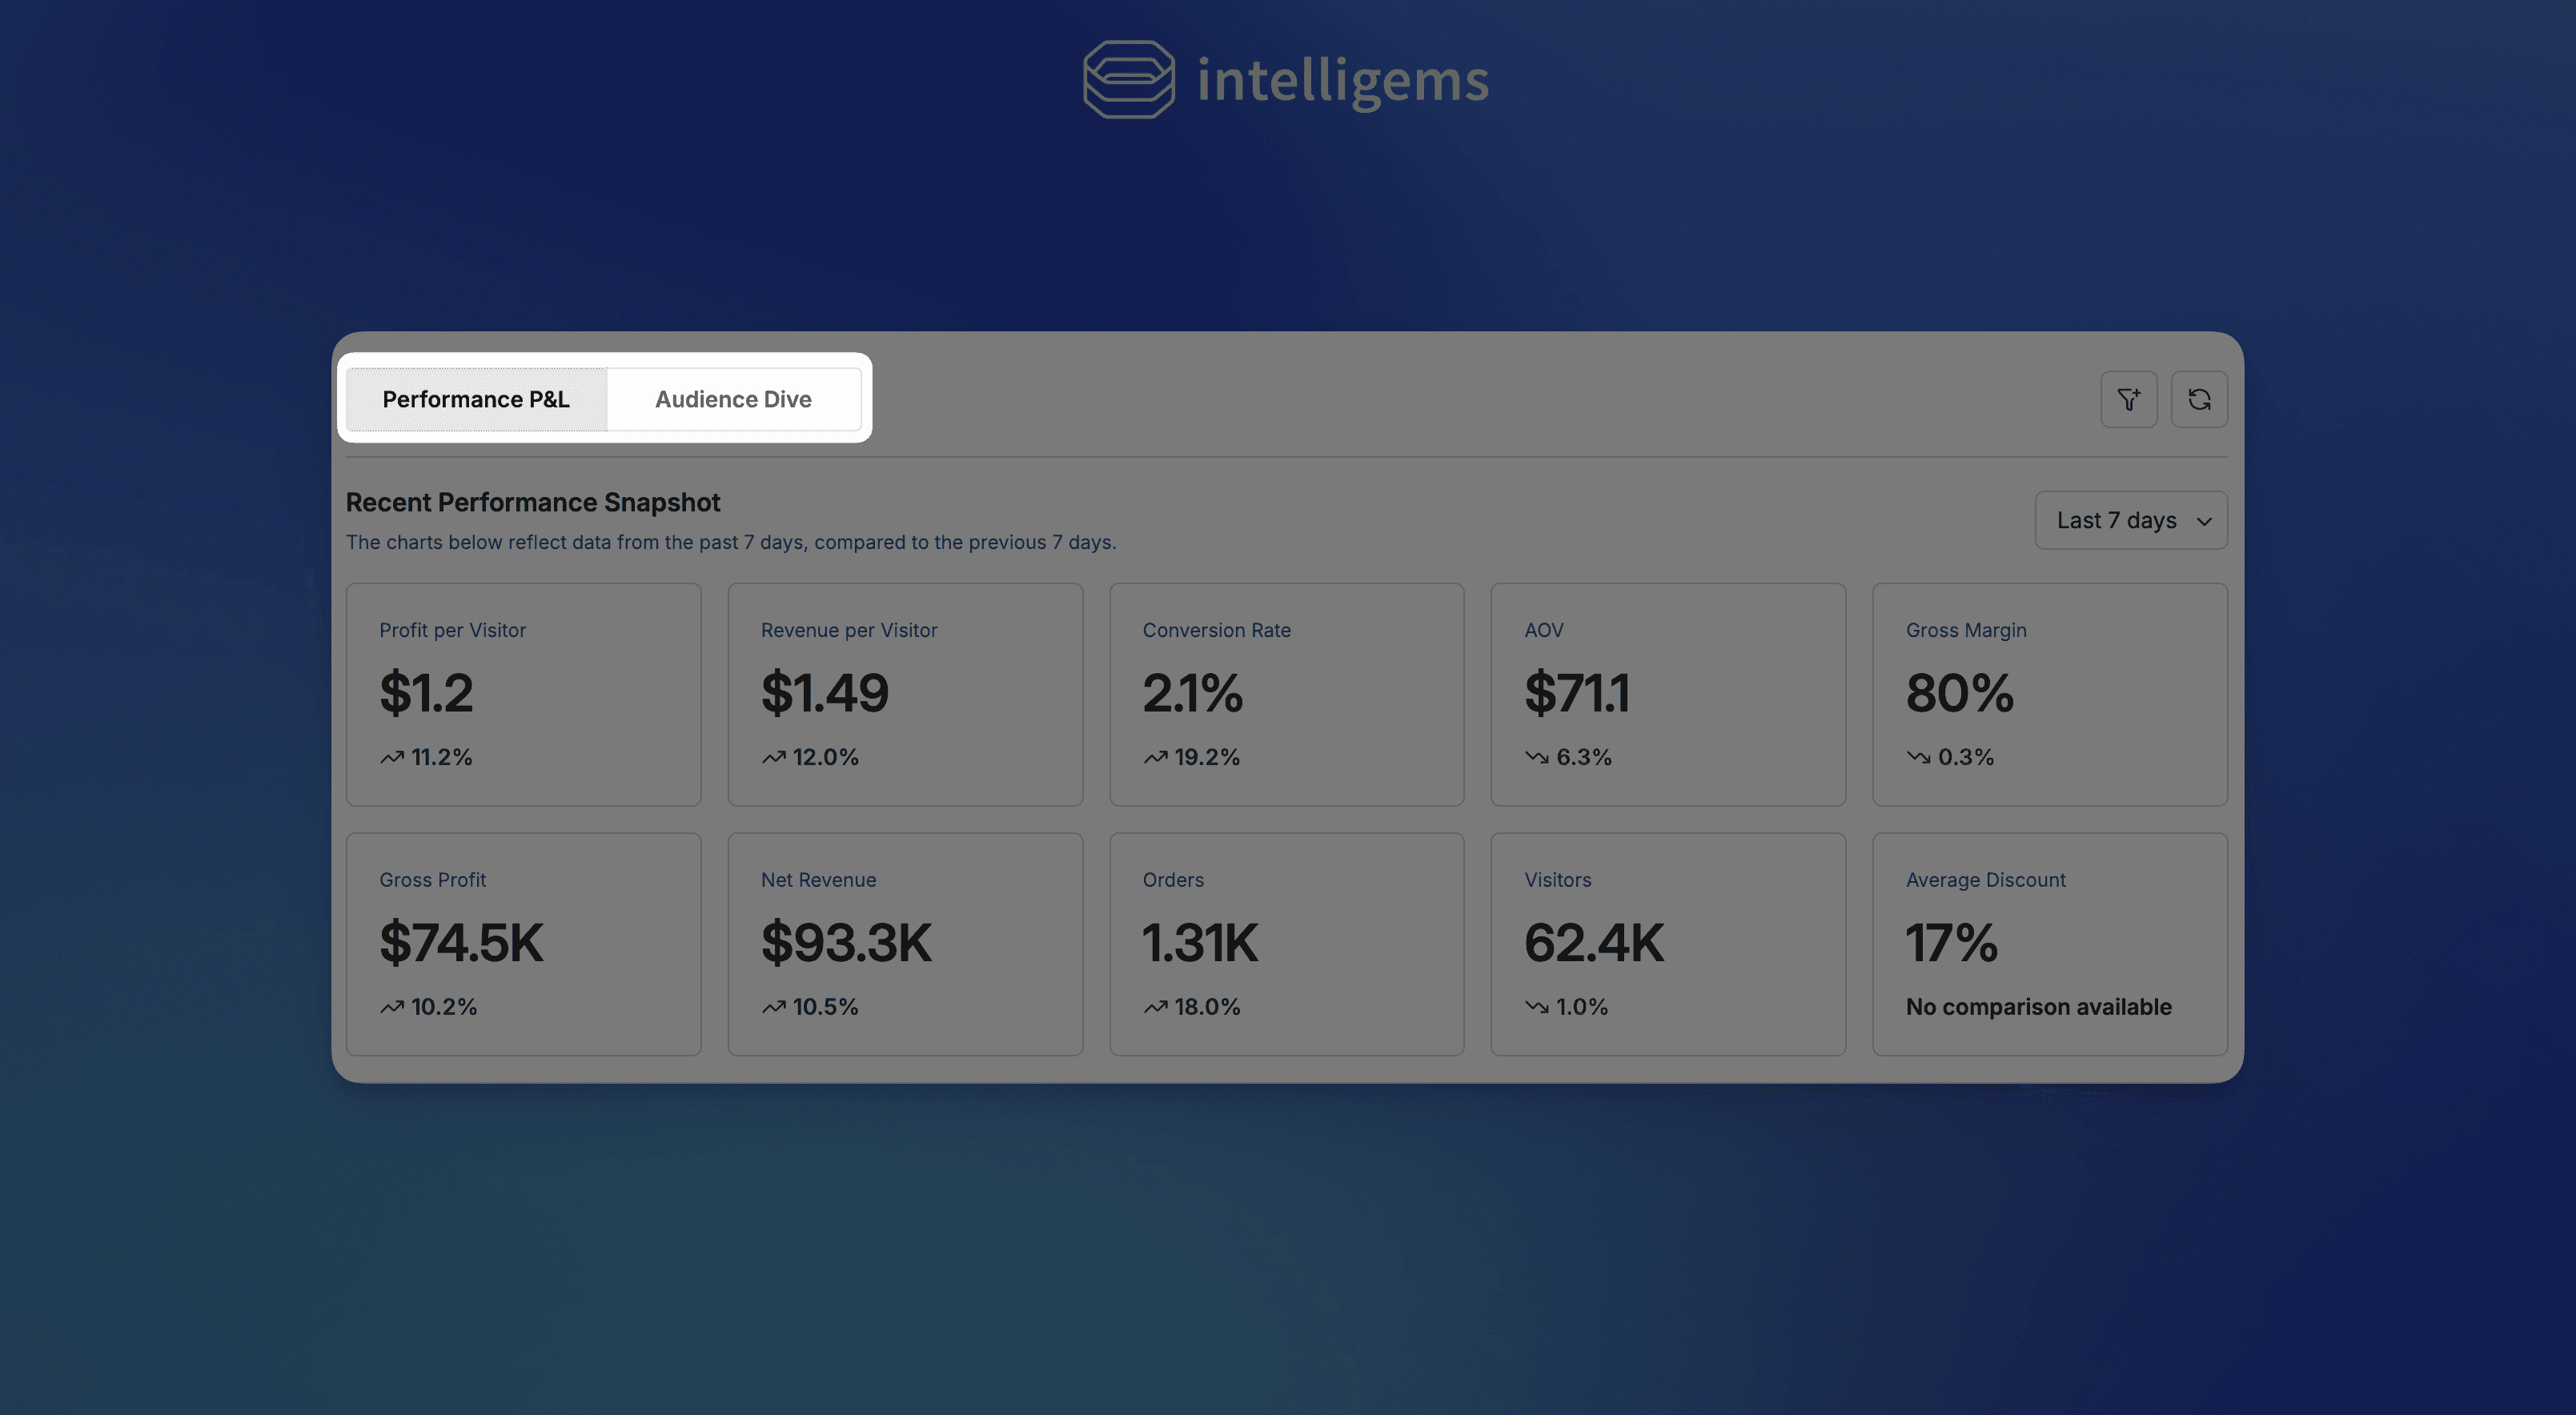
Performance P&L: The store-level view that shows what happened across your entire business. This is where you see:
Visitors: Total traffic to your store
Conversion Rate: Percentage of visitors who complete a purchase
Average Order Value (AOV): Revenue per order
Product Margin %: Profit margin on products after COGS
Shipping Margin: Profit or loss from shipping after costs
Profit per Visitor (PPV): The hero metric that shows how much profit you generate per store visitor
Revenue per Visitor (RPV): Companion metric to PPV for trend comparison
Audience Dive: The audience-level view that shows who drove those results. Break down all metrics by:
Device: Mobile vs Desktop
Visitor Type: New vs Returning
Channel: Paid Social, Organic Search, Direct, Email, and more
Country: Top 10 traffic sources by country
Landing Page: Top 10 entry points to your site
You can also apply filters to cross-slice these dimensions. Want to see mobile conversion by channel? Desktop profit per visitor by country? Returning visitor AOV by landing page? The filters make it possible.
Now for the valuable part: what insights can you actually find with all of this?
Analytics Insights You Can Finally See
There are dozens of insights hiding in your data that Shopify and GA4 don't surface. Here are a few to get started:
Is mobile driving profit or just traffic?
Mobile might represent 70% of your traffic but only 45% of profit per visitor. That's not a mobile problem. It's a signal that your mobile experience, pricing, or offer strategy needs testing.
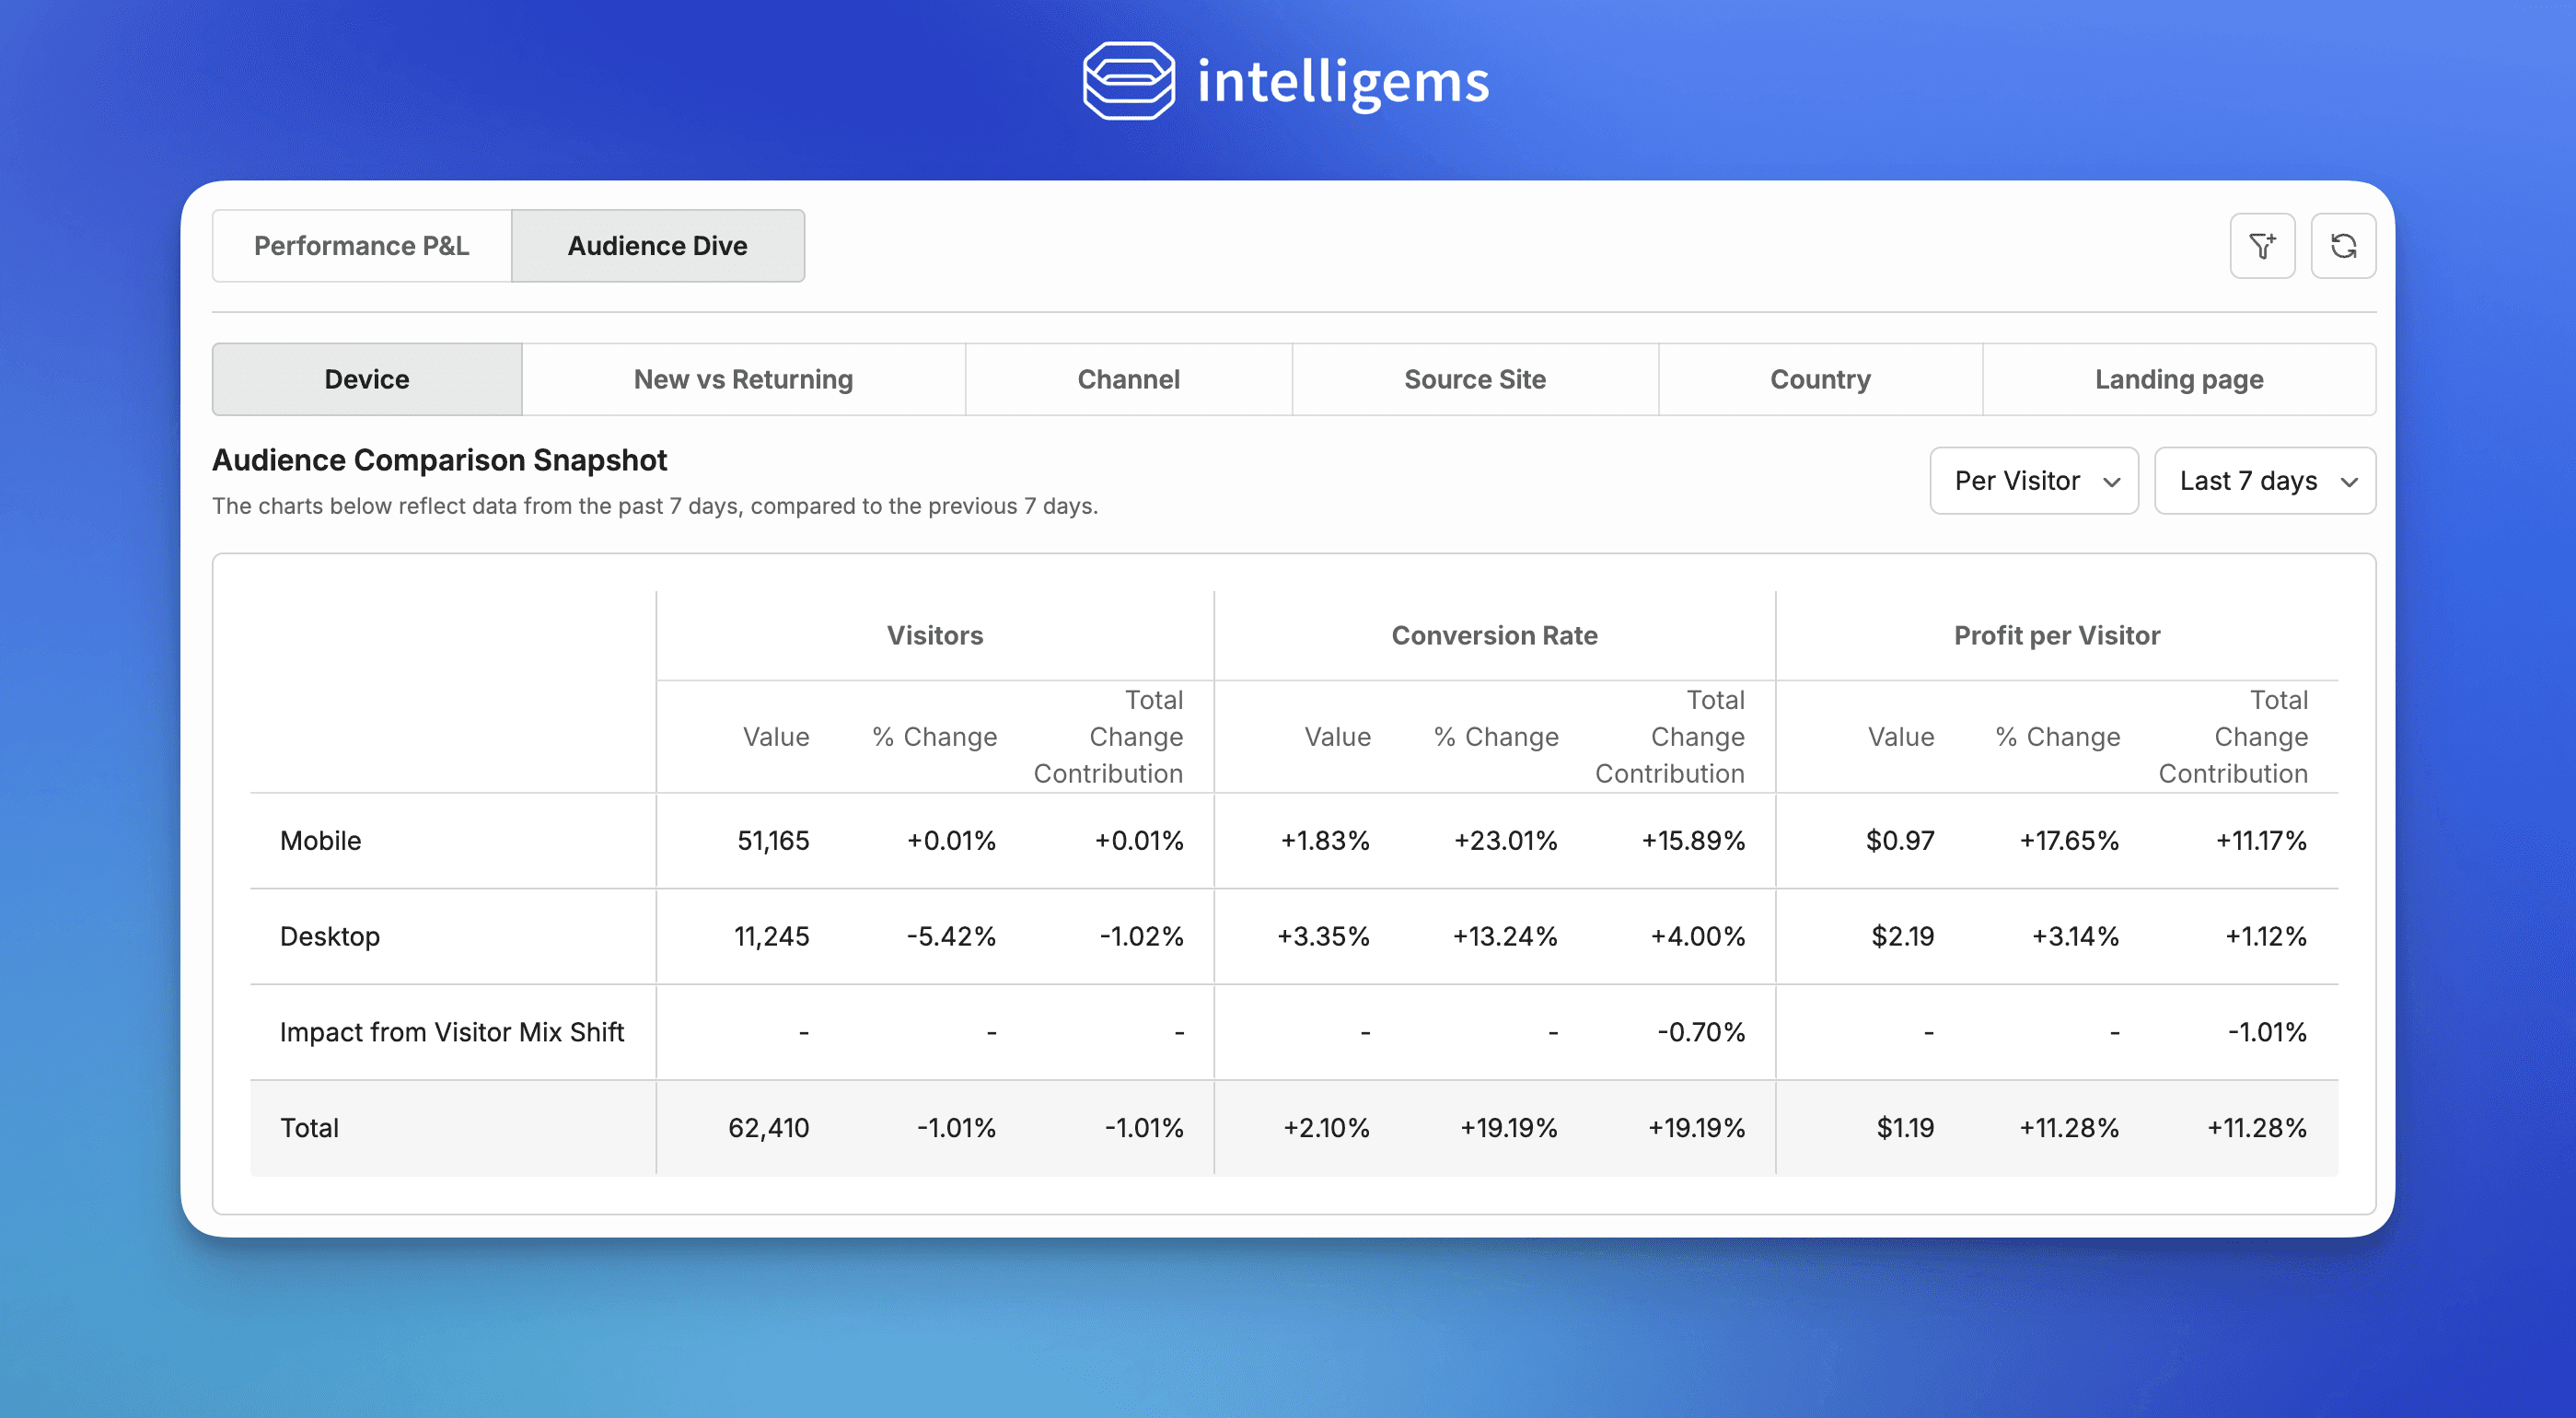
Mobile vs Desktop comparison in Audience Dive showing visitor volume, conversion rate differences, and profit per visitor. Notice how Visitor Mix Shift quantifies the impact of traffic composition changes on overall performance.
Which channels are worth the ad spend?
Paid social drives high traffic but converts at 1.8% with $65 AOV. Email drives less traffic but converts at 3.2% with $95 AOV. Revenue per visitor might look similar, but profit per visitor tells you which channel actually pays.
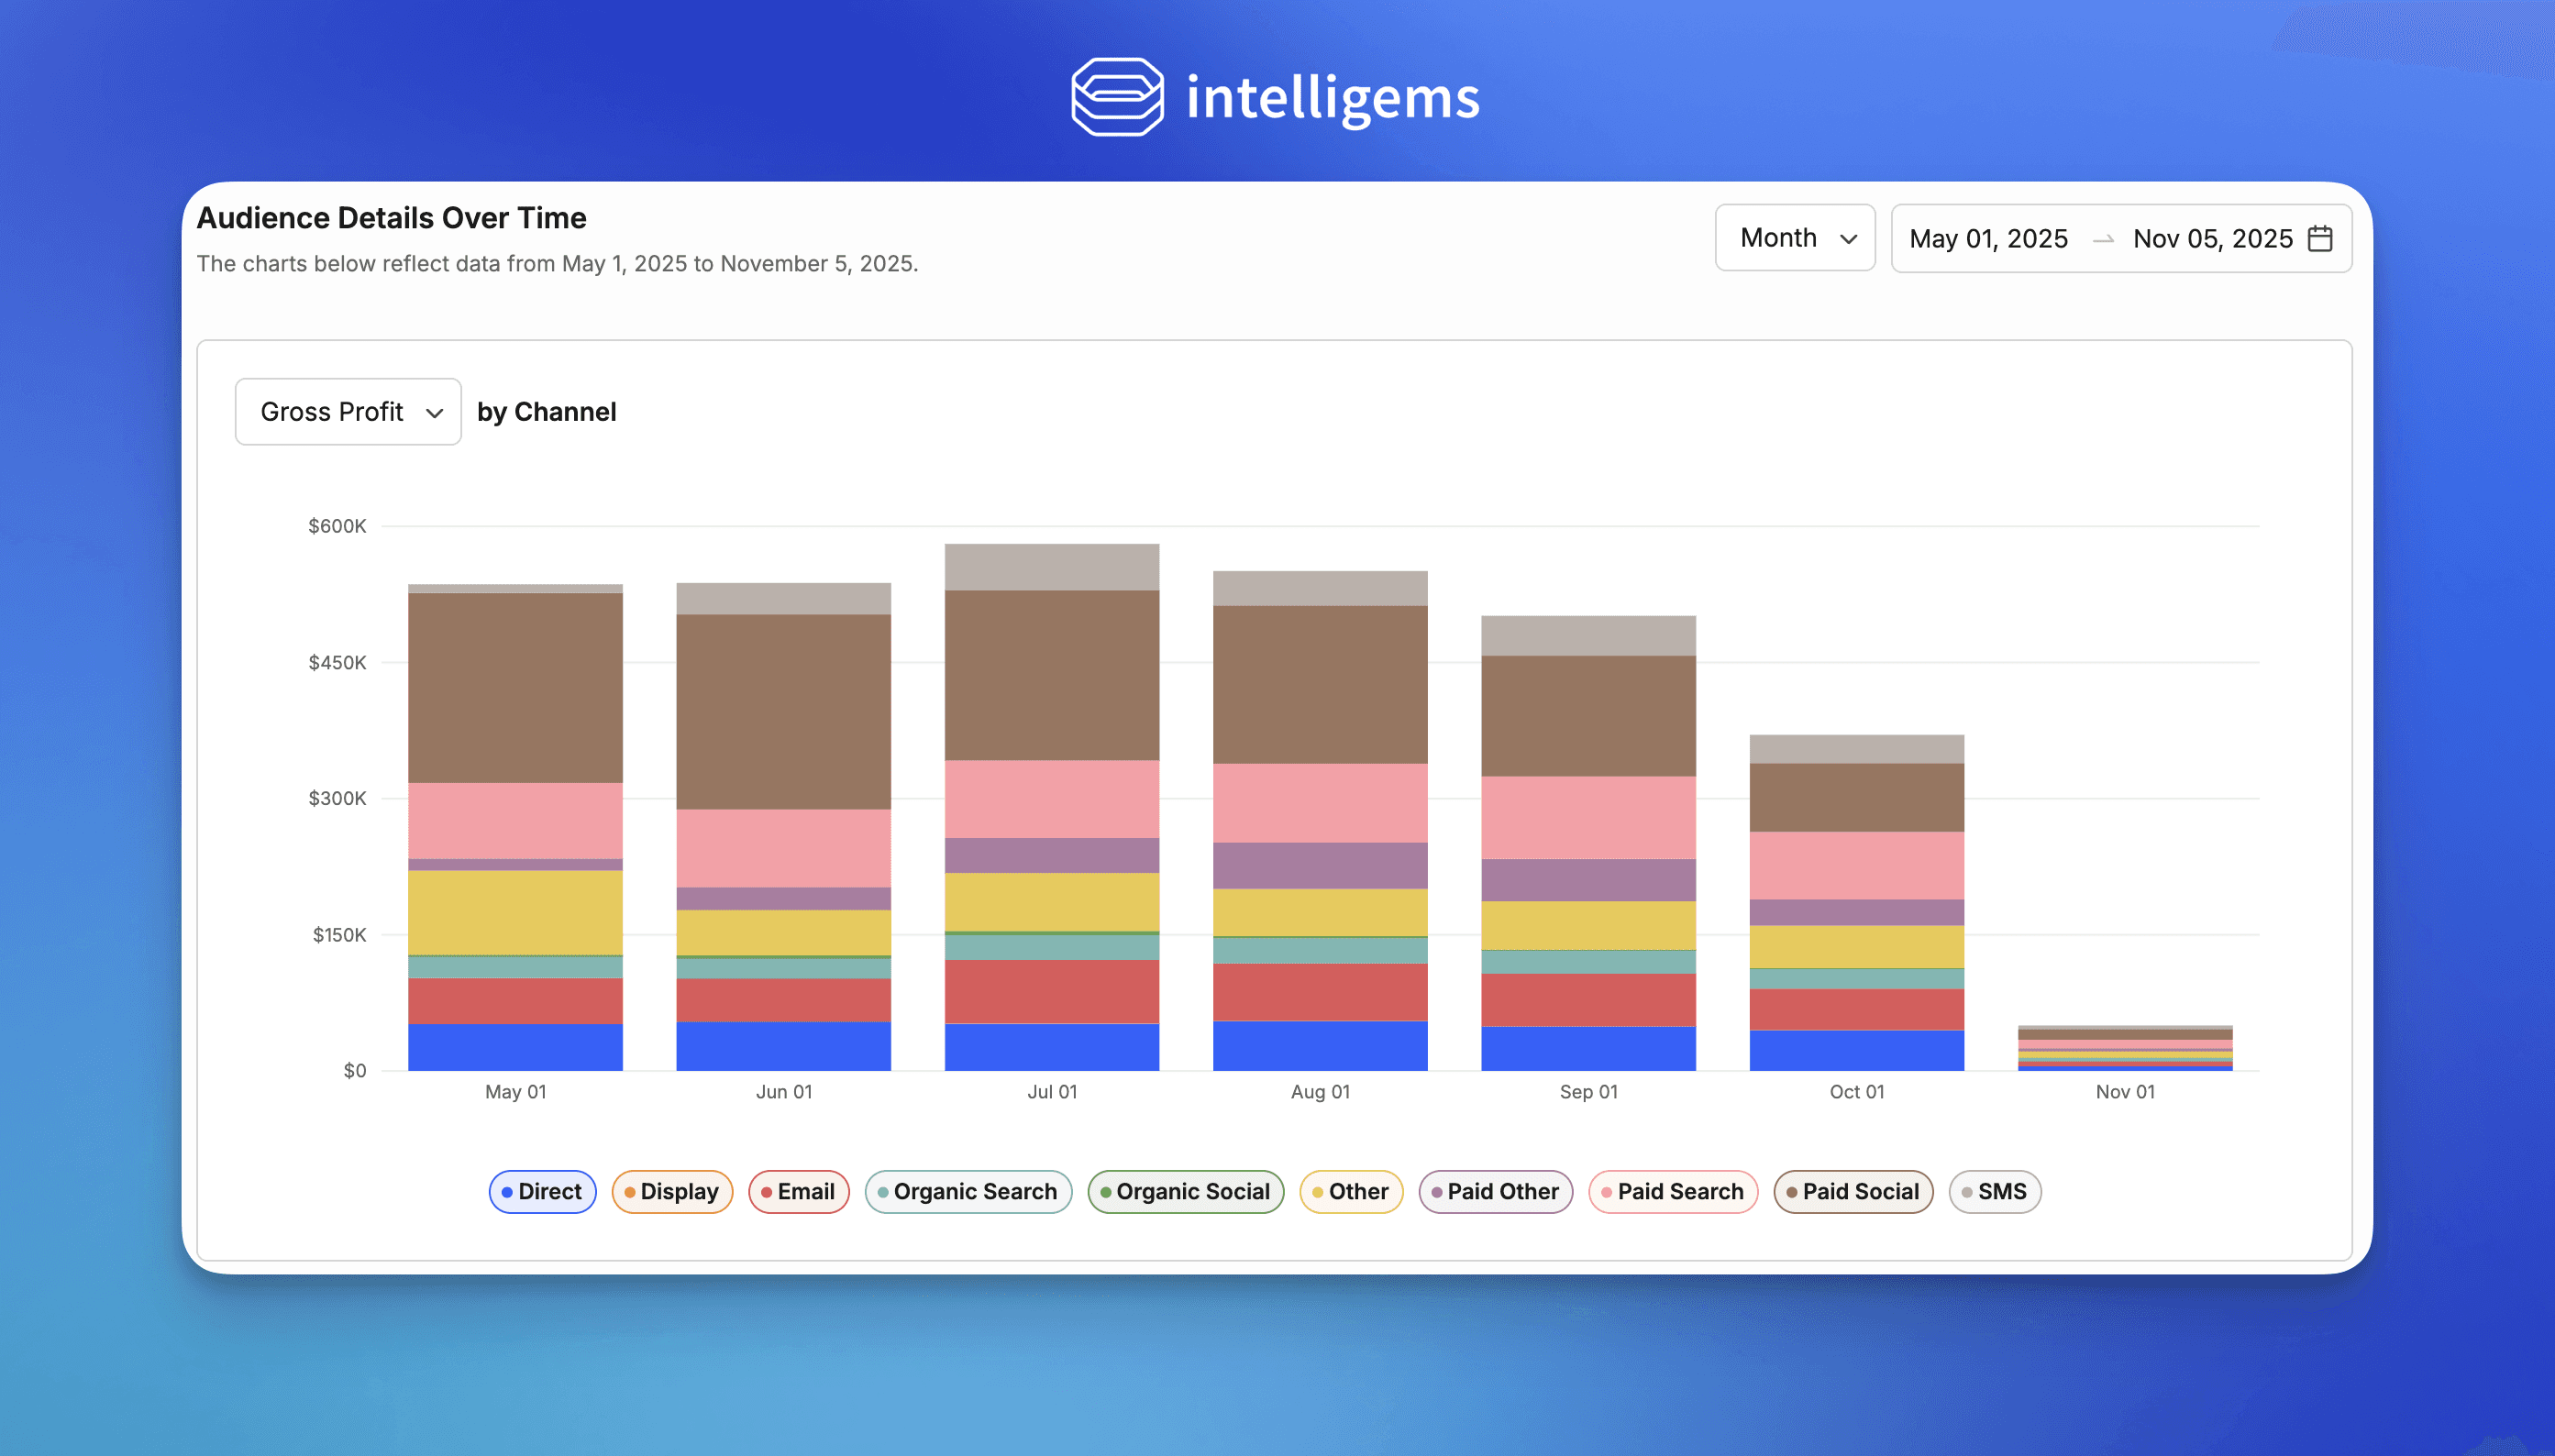
Channel breakdown in Audience Dive showing how Paid Social, Email, Organic Search, and other channels compare on profit per visitor. While revenue per visitor might look similar across channels, profit per visitor reveals which sources truly drive profitable growth.
Is your conversion rate dropping because of performance or traffic mix?
Conversion dropped from 2.5% to 2.3% last week. But Visitor Mix Shift analysis shows that mobile traffic increased from 65% to 72%, and mobile naturally converts lower. Your store didn't perform worse. Your traffic mix changed. Sitewide Analytics calculates this automatically.
Are new visitors more profitable than returning visitors?
New visitors convert at 1.9% with $72 AOV. Returning visitors convert at 4.1% with $68 AOV. Profit per visitor reveals which segment drives more value and whether your retention strategy is working.
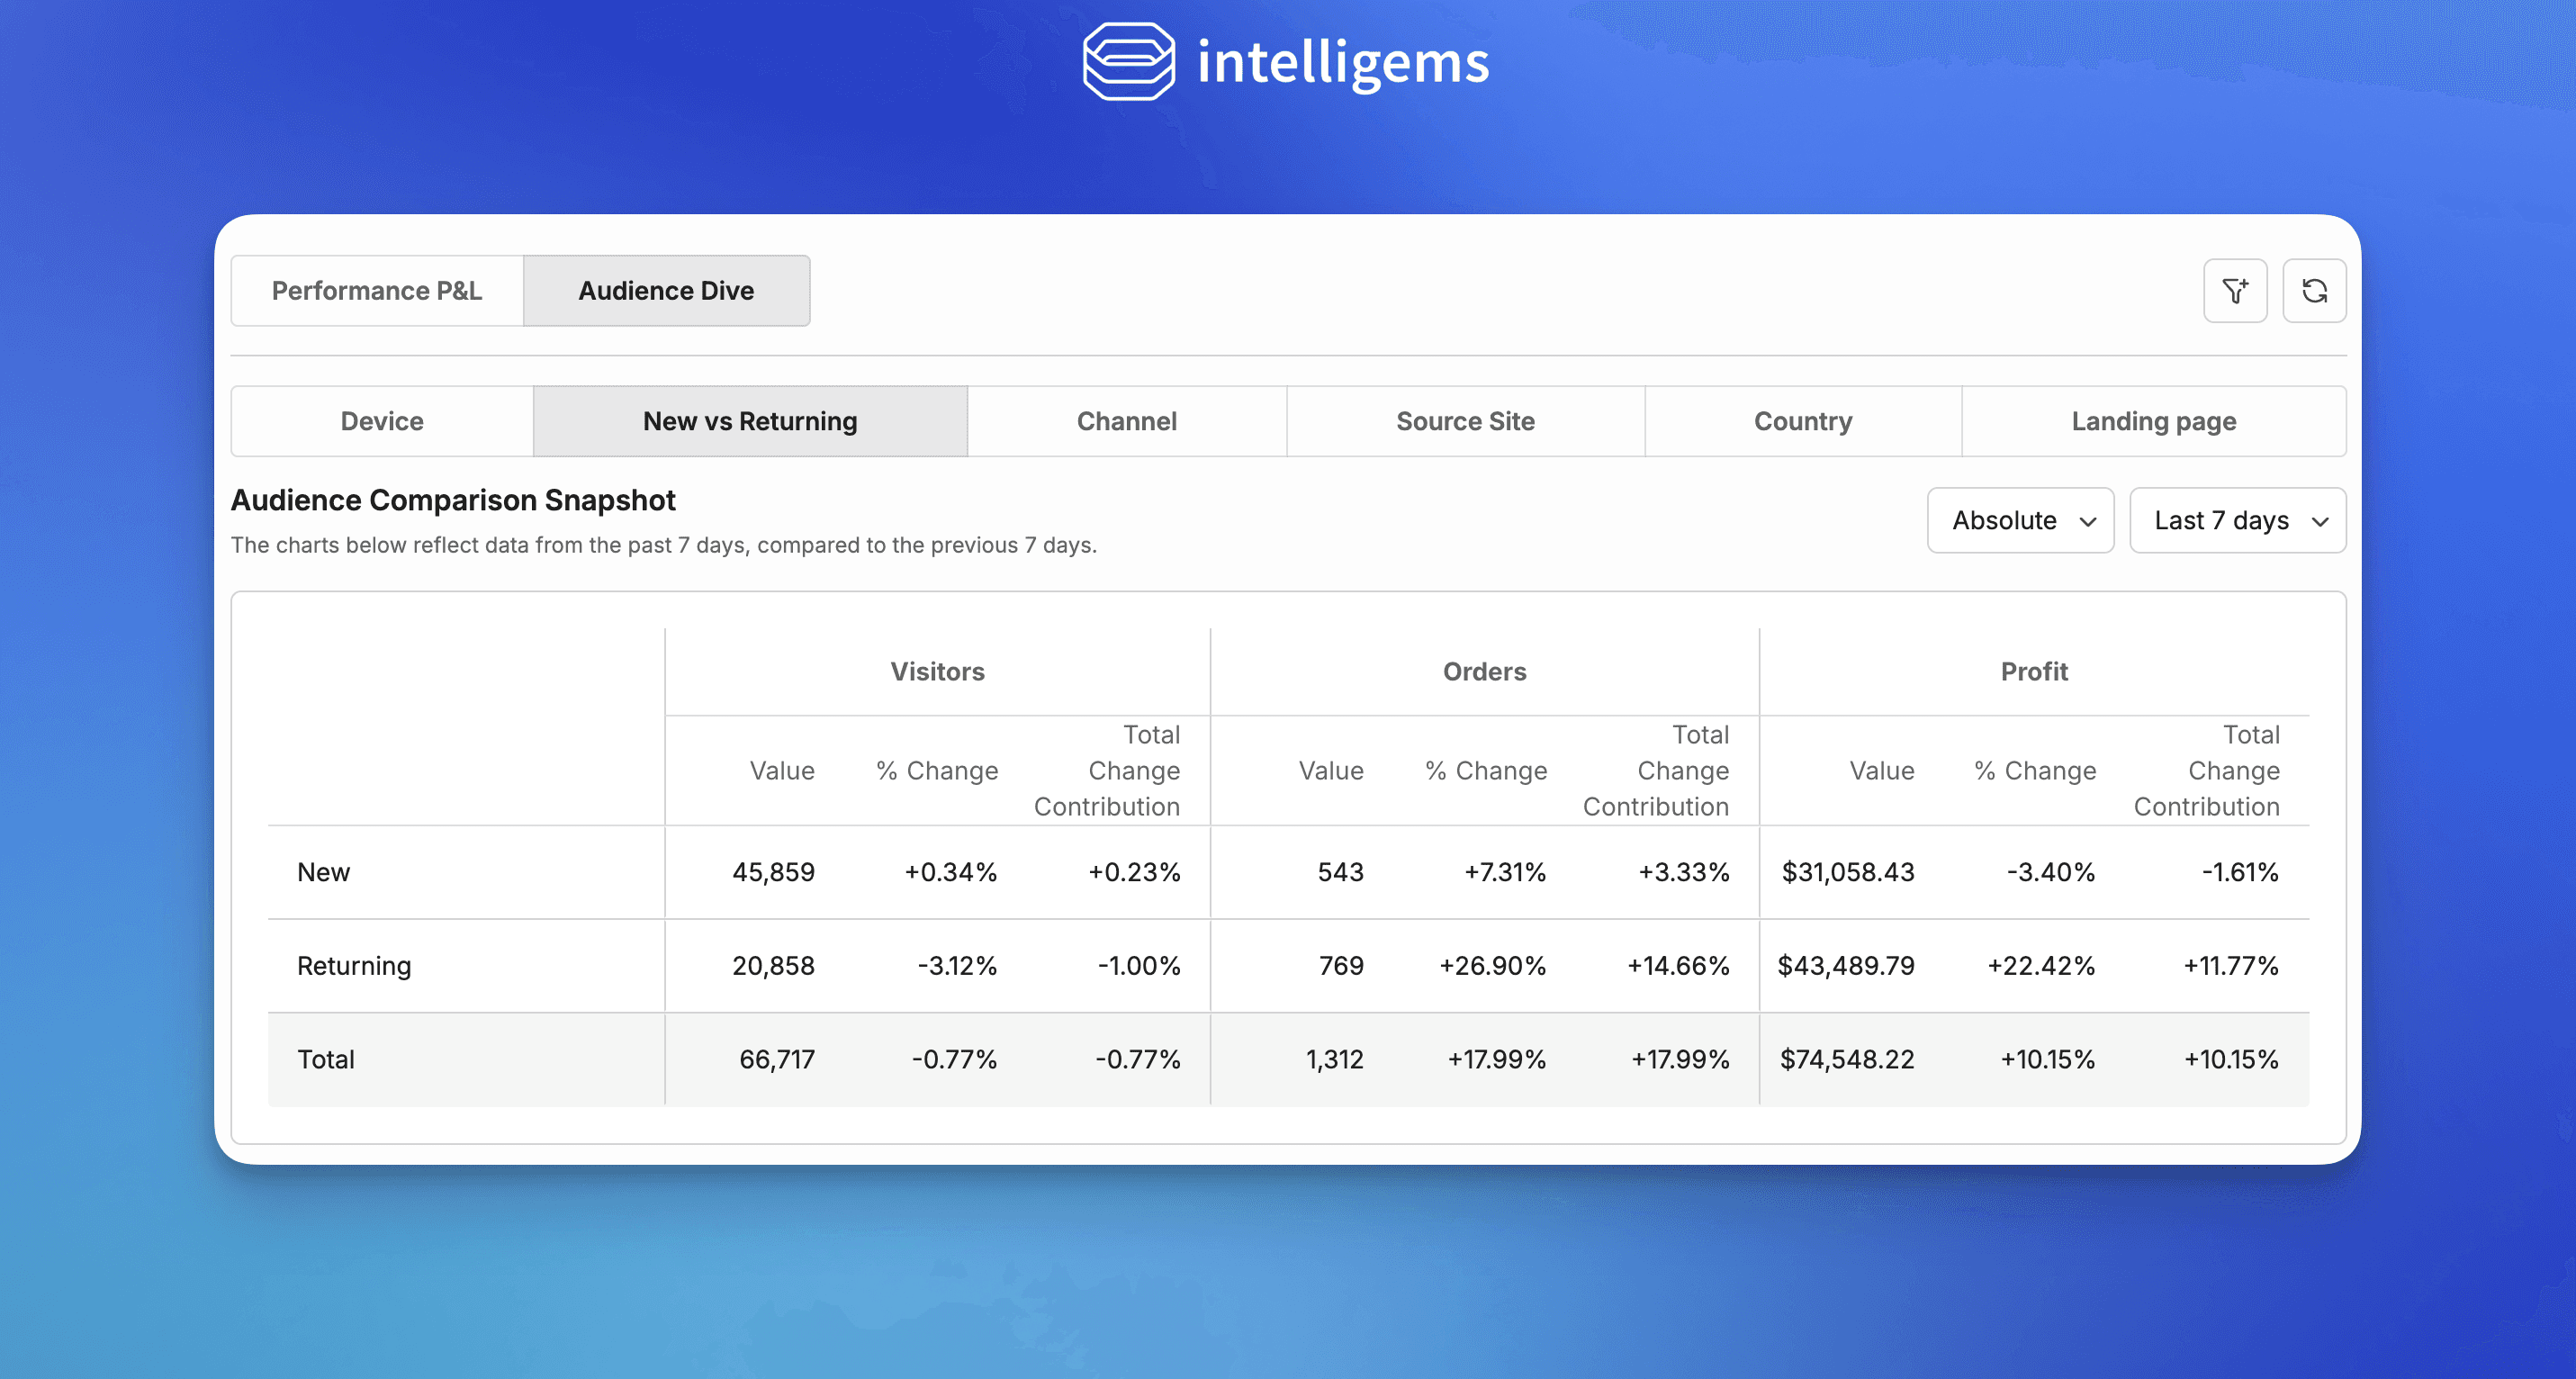
New vs Returning visitor analysis showing how conversion rates and profit differ between segments. Use this view to evaluate whether your retention strategy is driving the profit mix you expect.
Does desktop justify its lower volume?
Desktop represents only 30% of traffic but converts at 3.8% vs mobile's 2.1%. AOV is $88 vs $64. Profit per visitor is $2.10 vs $1.05. That 30% of traffic generates nearly half your profit.
Which countries should you localize for?
Traffic from the UK converts at 2.8% with $75 AOV, but shipping costs reduce profit per visitor to $0.95. Traffic from Canada converts at 2.4% with $82 AOV, and lower shipping costs result in $1.40 profit per visitor. Where should you invest in localization?
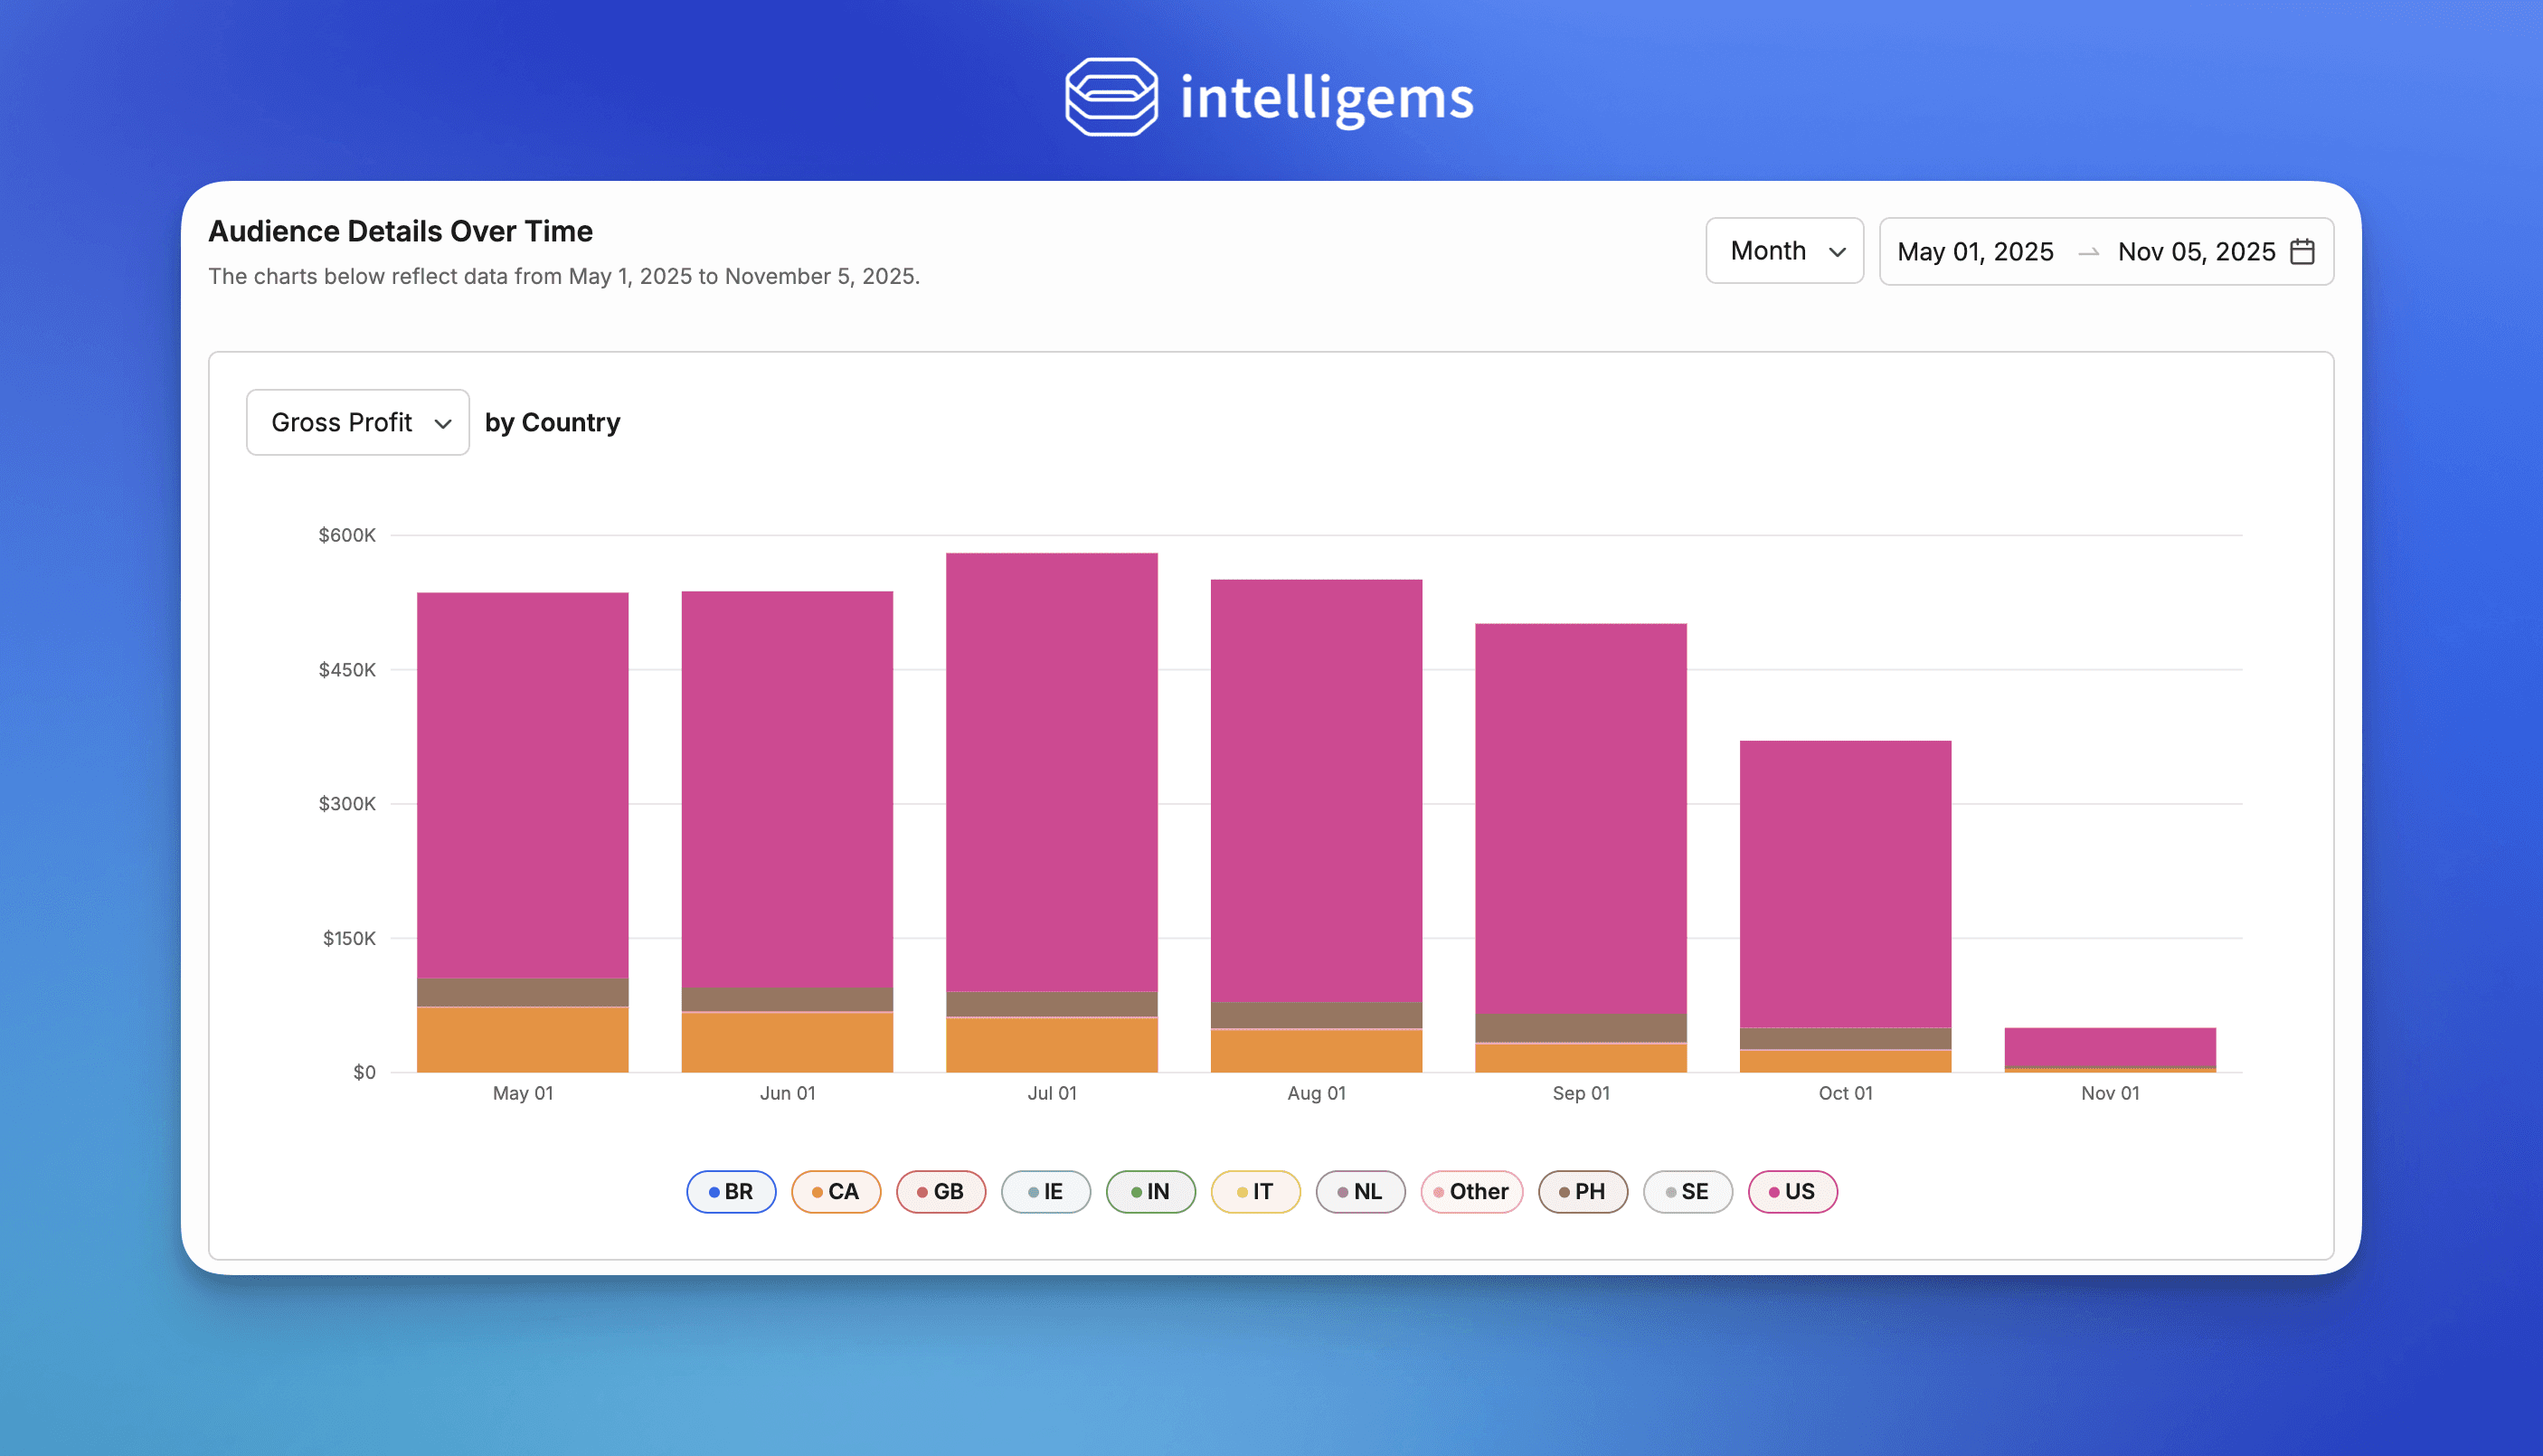
Country-level breakdown showing how conversion rates, AOV, and shipping costs combine to drive different profit per visitor across geographies. This view helps prioritize localization investments by revealing which countries offer the best margin profiles.
Pro Tips for Using Sitewide Analytics
Focus on profit, compare per visitor, and cross-slice with filters
Now that you know what you can see, here are some tips to get the most value from Sitewide Analytics.
Focus on profit per visitor, not just conversion or revenue. Conversion might increase while margin drops. Revenue might grow while profit shrinks. Profit per visitor captures whether your business actually improved.
Toggle between Per Visitor and Absolute views. Per Visitor normalizes for traffic volume, making it easier to compare segments. Absolute shows total dollars and helps you prioritize high-impact audiences. Use both.
Upload COGS for full profit visibility. Sitewide Analytics works without COGS, but uploading your cost of goods sold unlocks every profit-related metric. It's a one-time setup that transforms what you can see.
Use filters to cross-slice dimensions. Don't just look at mobile vs desktop. Look at mobile paid social vs mobile organic search. Or returning visitors on desktop from email. Filters let you dig deeper into the patterns.
Pay attention to Visitor Mix Shift. This metric explains performance swings caused by traffic mix changes, not store performance. If mobile traffic surges and conversion drops, Visitor Mix Shift tells you how much of that drop came from the mix change vs actual mobile performance decline.
Compare % Change and Total Change Contribution. % Change shows relative performance within a segment (e.g., Desktop traffic up 10%). Total Change Contribution shows how that segment's change affected total site performance (e.g., Desktop growth contributed +2% of overall traffic change). This helps prioritize meaningful movements over noise.
Default to "Matched to Session" view. This view shows orders where Intelligems directly observed the checkout journey. "All Orders" includes POS, subscriptions, and other non-web orders that didn't reach checkout. Matched to Session gives cleaner insights for web performance.
How to Get Started
See which audiences drive profit in under 20 minutes
Step 1: Upload COGS if you haven't already. Go to Settings → Product Costs in Intelligems and upload your cost of goods sold. This unlocks full profit visibility across every metric. Without COGS, you'll still get valuable insights, but the profit metrics will be incomplete.
Step 2: Open Performance P&L and review your baseline. Look at Profit per Visitor, Revenue per Visitor, Conversion Rate, and AOV over the past 30 days. These are your baseline numbers. Notice any trends or unusual spikes?
Step 3: Look for patterns in the trend charts. Did profit per visitor drop while revenue per visitor increased? That suggests margin compression. Did conversion spike on certain weeks? That might signal promotional impact or seasonal behavior.
Step 4: Switch to Audience Dive and compare segments. Start with Device. Compare mobile vs desktop profit per visitor and conversion rate. Then check Visitor Type (new vs returning). Then Channel. Look for segments that significantly outperform or underperform the average.
Step 5: Act on what you find. If mobile profit per visitor lags desktop, test mobile-specific offers or checkout optimizations. If paid social underperforms organic search, review your ad targeting or landing pages. If returning visitors drive higher profit, test retention strategies to bring more visitors back.
Sitewide Analytics doesn't just show you data. It shows you where to focus your next test.
Note: Sitewide Analytics is available on all Intelligems plans when COGS is uploaded. Two pages are live today: Performance P&L and Audience Dive. Additional pages including product-specific performance, conversion funnel metrics, and test overlays are coming in Q1.
Ready to see which audiences drive profit for your business? When you're ready to make decisions with real profit data, let's get you started.
Ecommerce Strategy
AB Testing
AB Testing
