AB Testing
Mar 12, 2026
5 Experiments Homegoods Brands Should Run
Homegoods is a strange category. You're selling $15 candles and $1,500 sofas in the same store. Some purchases are impulsive. Others take months of consideration and a measuring tape.

Homegoods is a strange category. You're selling $15 candles and $1,500 sofas in the same store. Some purchases are impulsive. Others take months of consideration and a measuring tape.
The challenge is that different products need different shopping experiences. What works for a throw pillow doesn't work for a dining table. And the stakes are higher when customers can't touch or sit on what they're buying.
What follows aren't universal rules. They're data signals that often reveal opportunities in homegoods. Your numbers will tell you which ones matter for your situation.
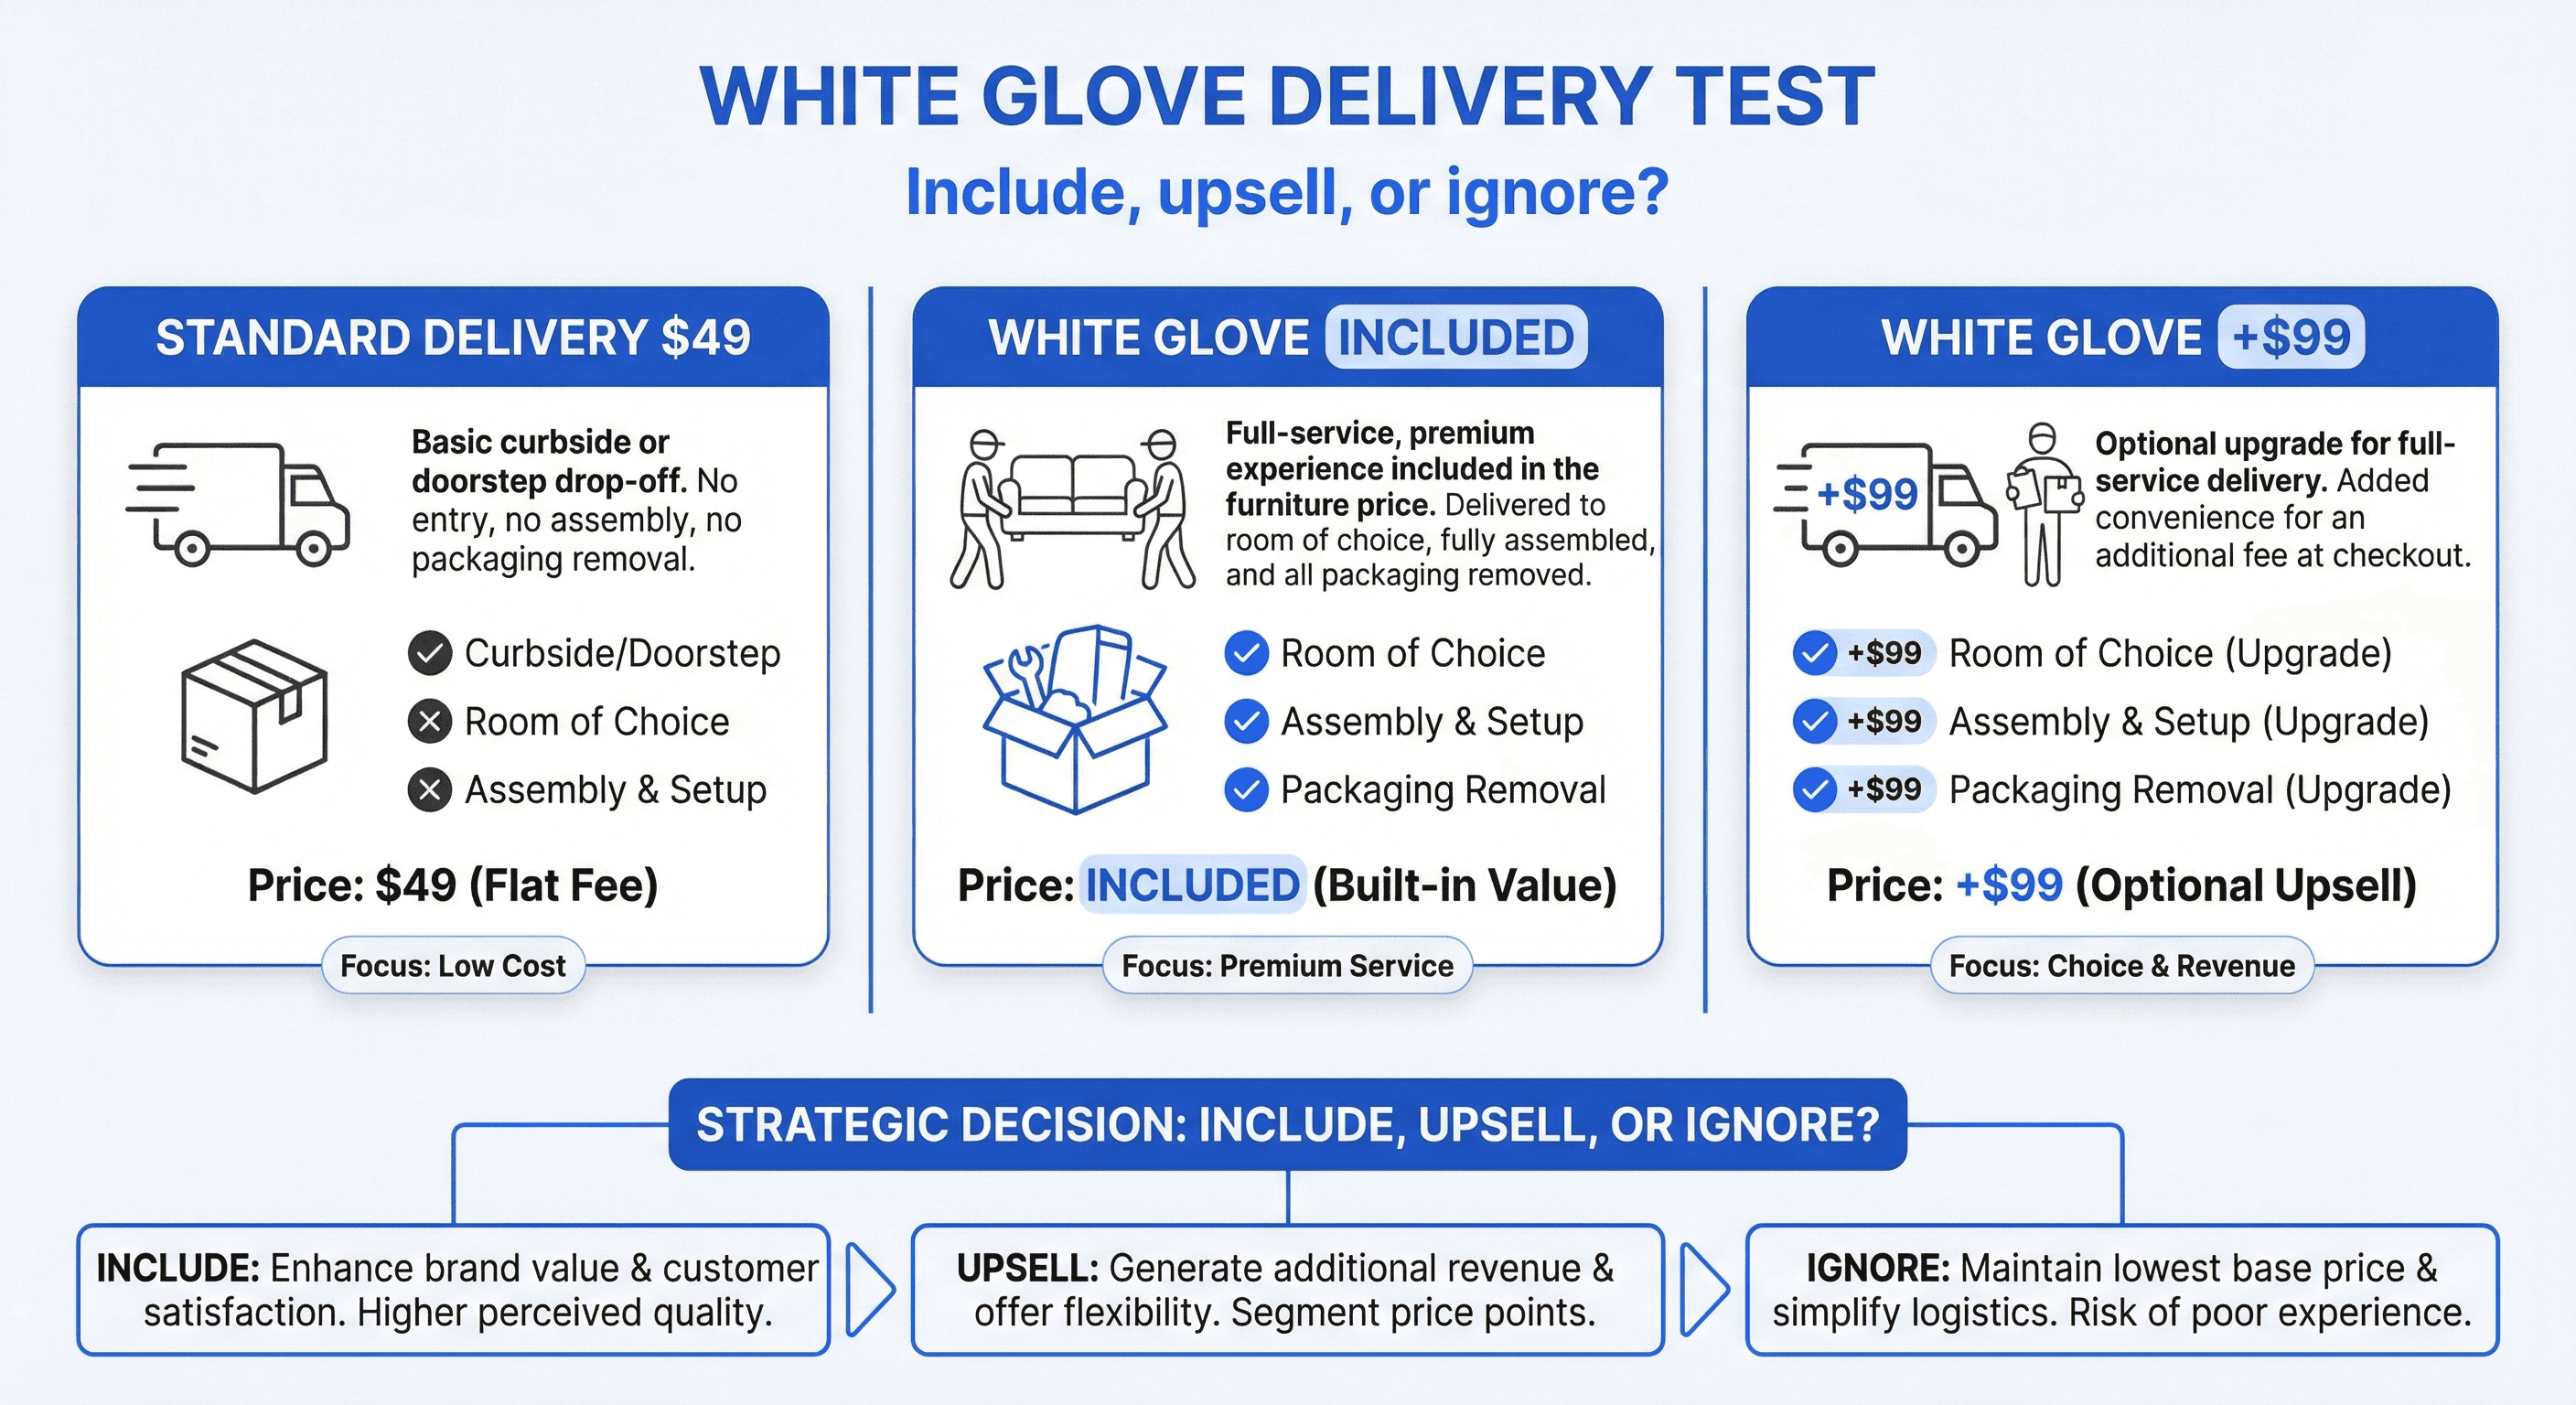
1. White Glove Delivery Option Pricing
Testing shipping rates: How different shipping strategies affect conversion and profit.
Your data signal: High abandonment on heavy or bulky items
If you're seeing customers abandon carts specifically on large furniture or heavy items, that pattern is worth investigating. They found the perfect bookshelf, added it to cart, then disappeared. What happened?
This often points to logistics anxiety. How will it get inside? Up the stairs? What if it arrives damaged? White glove delivery solves these worries, but the pricing and positioning matter. Including it in the price might scare off customers who don't need it. Offering it as an upsell might feel like nickel-and-diming. Your abandonment data by item weight can help you explore which approach reduces the friction using shipping testing.
What you might explore: White glove included in product price vs offered as an upsell at checkout vs not mentioned
Track this to understand: Profit per visitor, conversion rate on items over 50 pounds, cart abandonment by item weight
2. Room-Based Bundle Collections
Your data signal: Customers purchasing multiple items for the same room
If your data shows customers buying a rug, a lamp, and a throw blanket in the same order, that pattern reveals how they're thinking. They're not shopping by category. They're shopping by project.
This could indicate an opportunity to match your navigation to their mindset. Curating these patterns into room-based bundles might increase order value and reduce decision fatigue. Whether it works depends on how your customers respond to curated options versus browsing freely.
What you might explore: Curated room bundles featured prominently vs standard category-based navigation
Track this to understand: Profit per visitor, items per order, time to purchase

3. Quality and Durability Guarantee Messaging
Your data signal: High time on page for furniture items
If customers are spending six minutes on a sofa product page, that's worth investigating. They're not reading about dimensions. They're trying to figure out if this thing will hold up. Is it real wood or veneer? Will the cushions sag after a year?
This pattern often points to durability anxiety. Signals like warranties, material guarantees, or construction details can address these unspoken questions. Content testing can reveal which framing builds confidence. But different framings resonate with different customers. Some want technical specs. Others want a simple promise. Your time-on-page data by product category can guide where to explore.
What you might explore: Warranty badge prominently displayed vs detailed construction information vs "Built to last" messaging
Track this to understand: Profit per visitor, conversion rate on items over $300, time on page
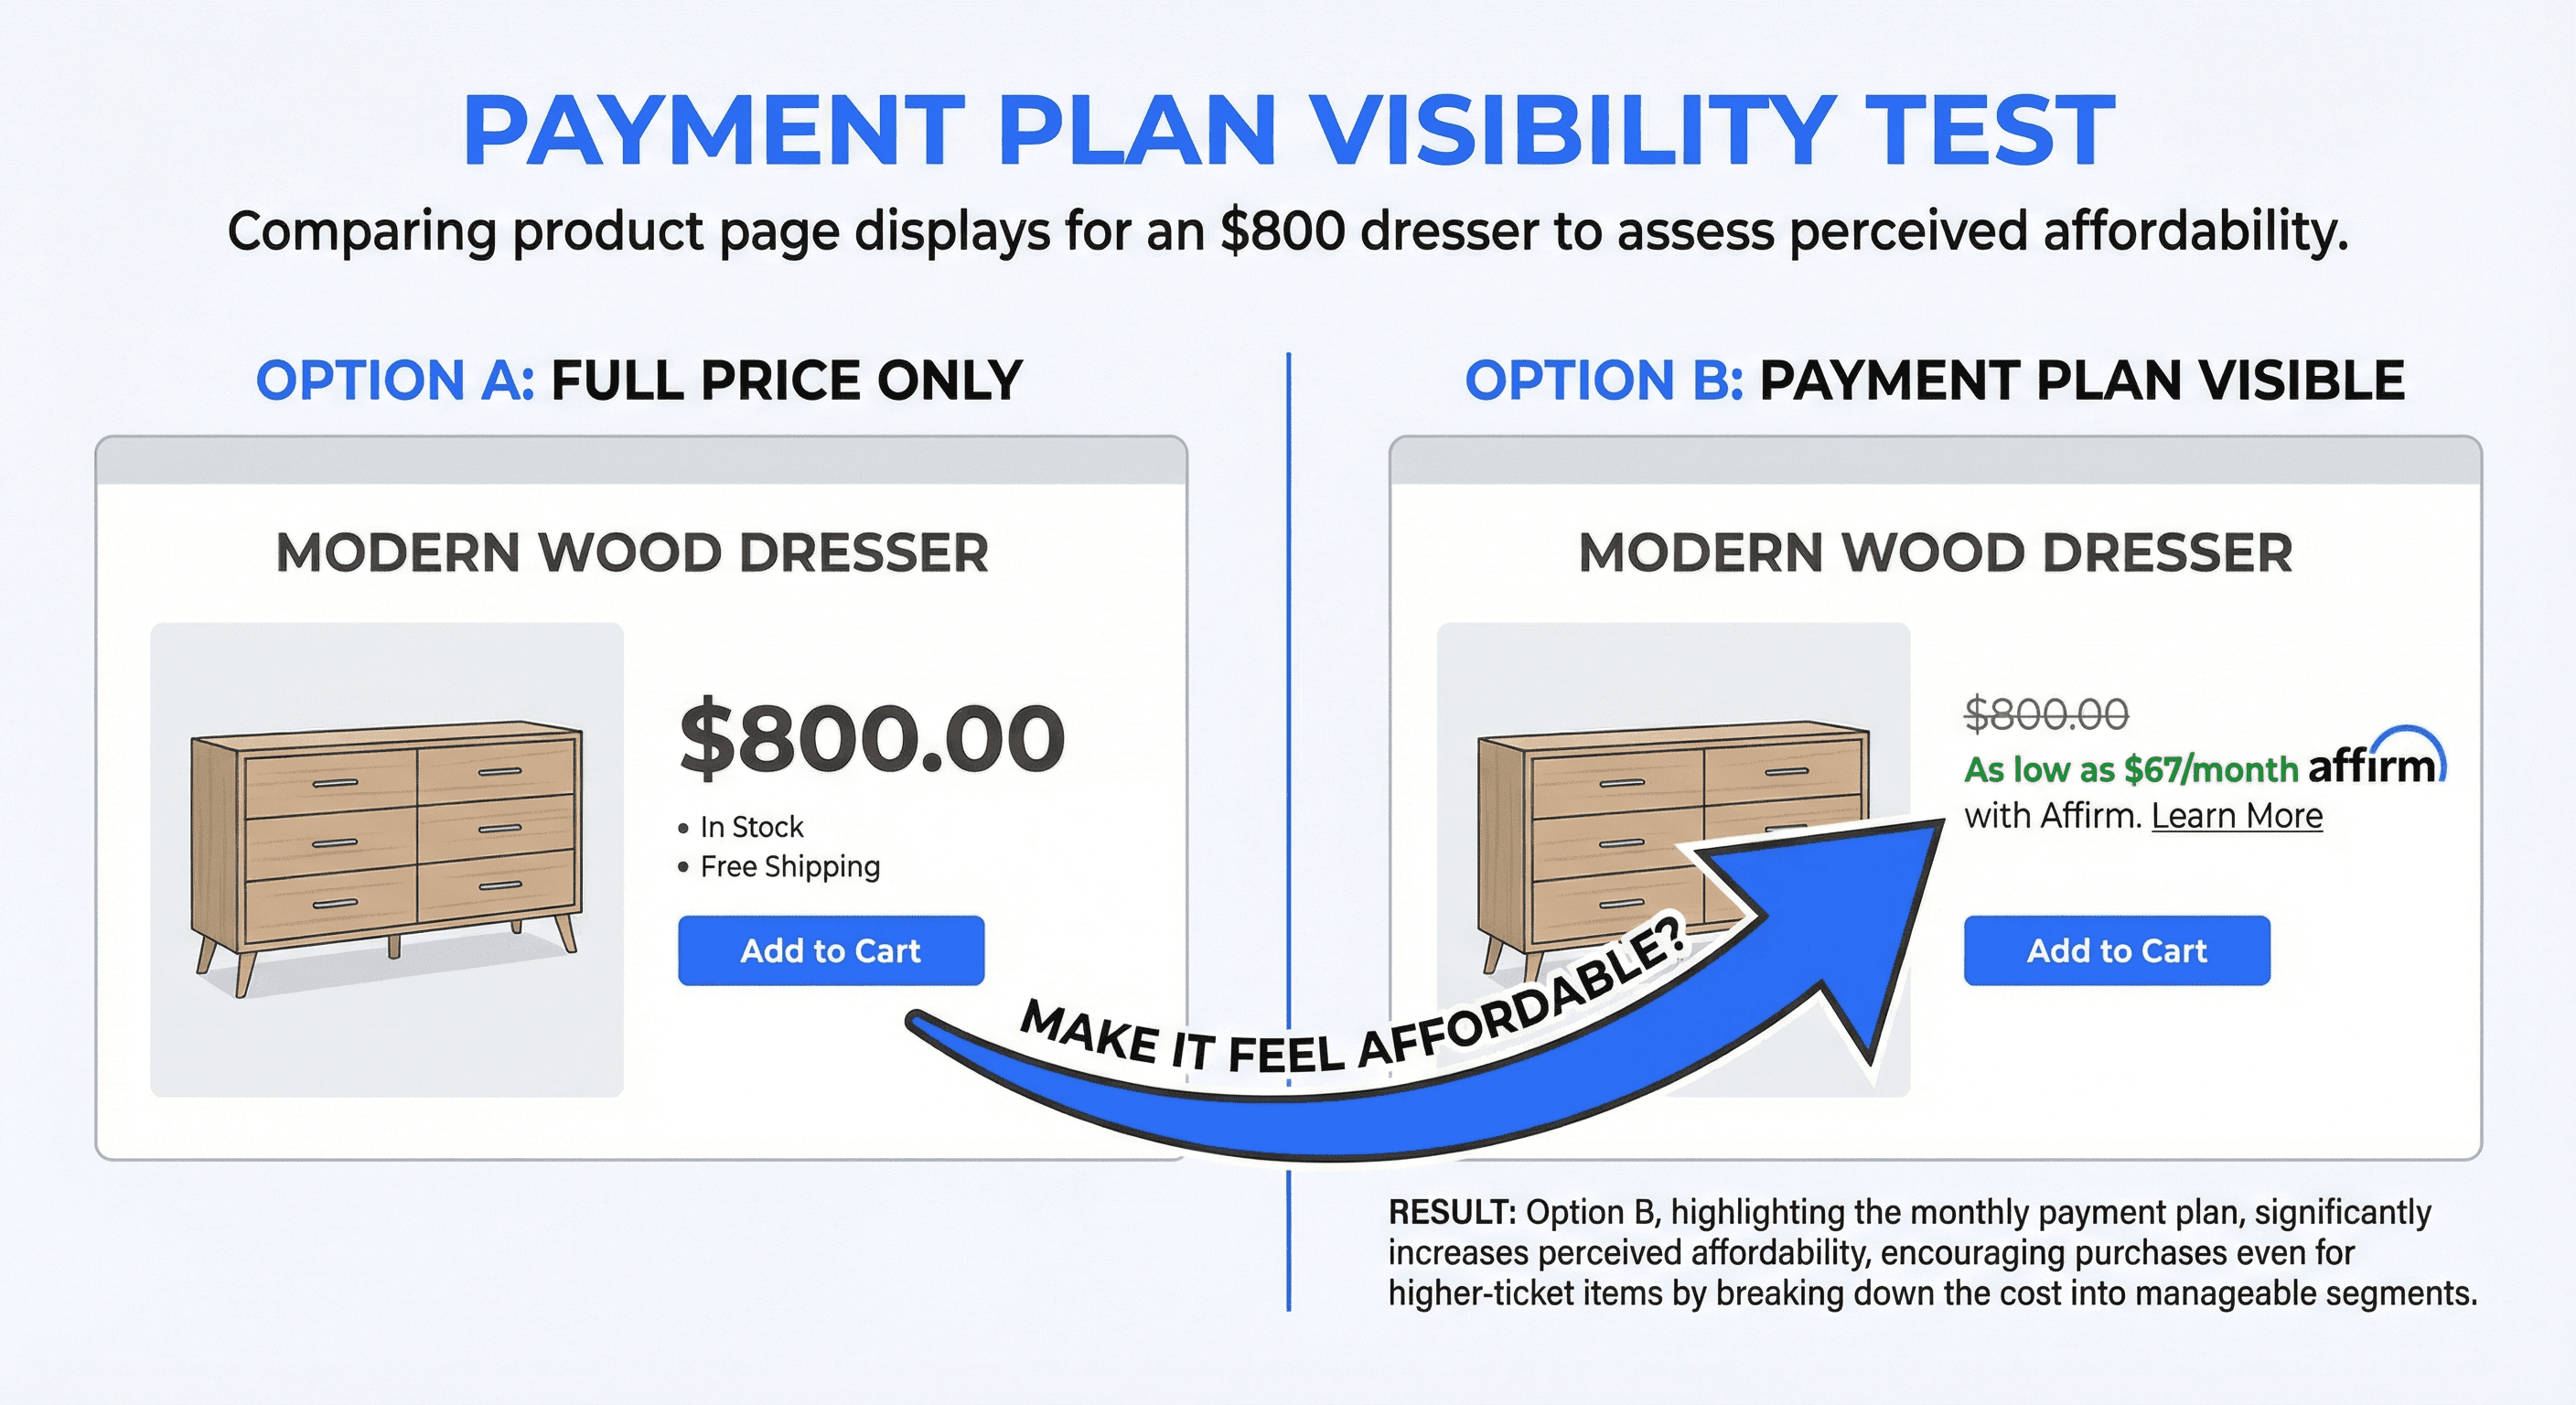
4. Payment Plan Visibility
Your data signal: High browse rate but low conversion on $500+ items
If you're seeing lots of looking but little buying on high-ticket items, that pattern reveals something about the barrier. Customers add an $800 dresser to their wishlist and then... nothing. The interest is there. The single-payment price tag might not be. This is a common checkout optimization challenge.
This could indicate an opportunity to surface payment options earlier. A small Affirm logo at checkout doesn't have the same impact as "As low as $67/month" on the product page. Where and how you show financing options might change whether customers can see themselves buying.
What you might explore: Payment plan pricing shown on product page vs payment options at checkout only vs both
Track this to understand: Profit per visitor, conversion rate by price tier, average order value
5. Project-Based Collection Messaging
Your data signal: Traffic spikes around moving season, holidays, or home events
If your traffic clusters around specific times, moving season, holiday prep, new baby, that pattern tells you something about customer intent. These visitors aren't casually browsing. They're on a mission with a deadline.
This could indicate a messaging opportunity. Generic collection pages ignore this context. Project-based messaging using experiences meets customers where they are. Same products, different framing. Whether it moves the needle depends on how strong those traffic patterns are in your data.
What you might explore: Project-based collection messaging vs standard "Shop by category" experience, segmented by traffic timing
Track this to understand: Profit per visitor, average order value, pages per session
Your Data Points the Way
These signals are starting points, not a checklist. The experiments worth running for your brand depend on what your own data is telling you.
If heavy items see high abandonment, delivery options might be worth exploring
If customers buy multiple items per room, bundles could match their mindset
If time on page is high for furniture, durability messaging might address the anxiety
If high-ticket items get viewed but not purchased, payment plan visibility could help
If traffic clusters around life events, project-based messaging might resonate
Your data tells you what to test. Start there.
AB Testing
AB Testing
AB Testing


