AB Testing
Mar 17, 2026
5 Experiments Drink and Electrolyte Brands Should Run
Electrolyte and drink brands have a unique position in ecommerce. Your customers need what you sell on a predictable schedule. They sweat, they workout, they get dehydrated. Then they need more.

Electrolyte and drink brands have a unique position in ecommerce. Your customers need what you sell on a predictable schedule. They sweat, they workout, they get dehydrated. Then they need more.
But the path from first purchase to loyal subscriber isn't automatic. You're competing against grocery store convenience, Amazon subscriptions, and a dozen other brands making similar promises. The brands winning this category aren't following a generic playbook. They're reading their own data and letting it guide what's worth testing.
What follows aren't prescriptions. They're data signals that often point to opportunities in drink and electrolyte brands. Your numbers will tell you which ones matter for your situation.
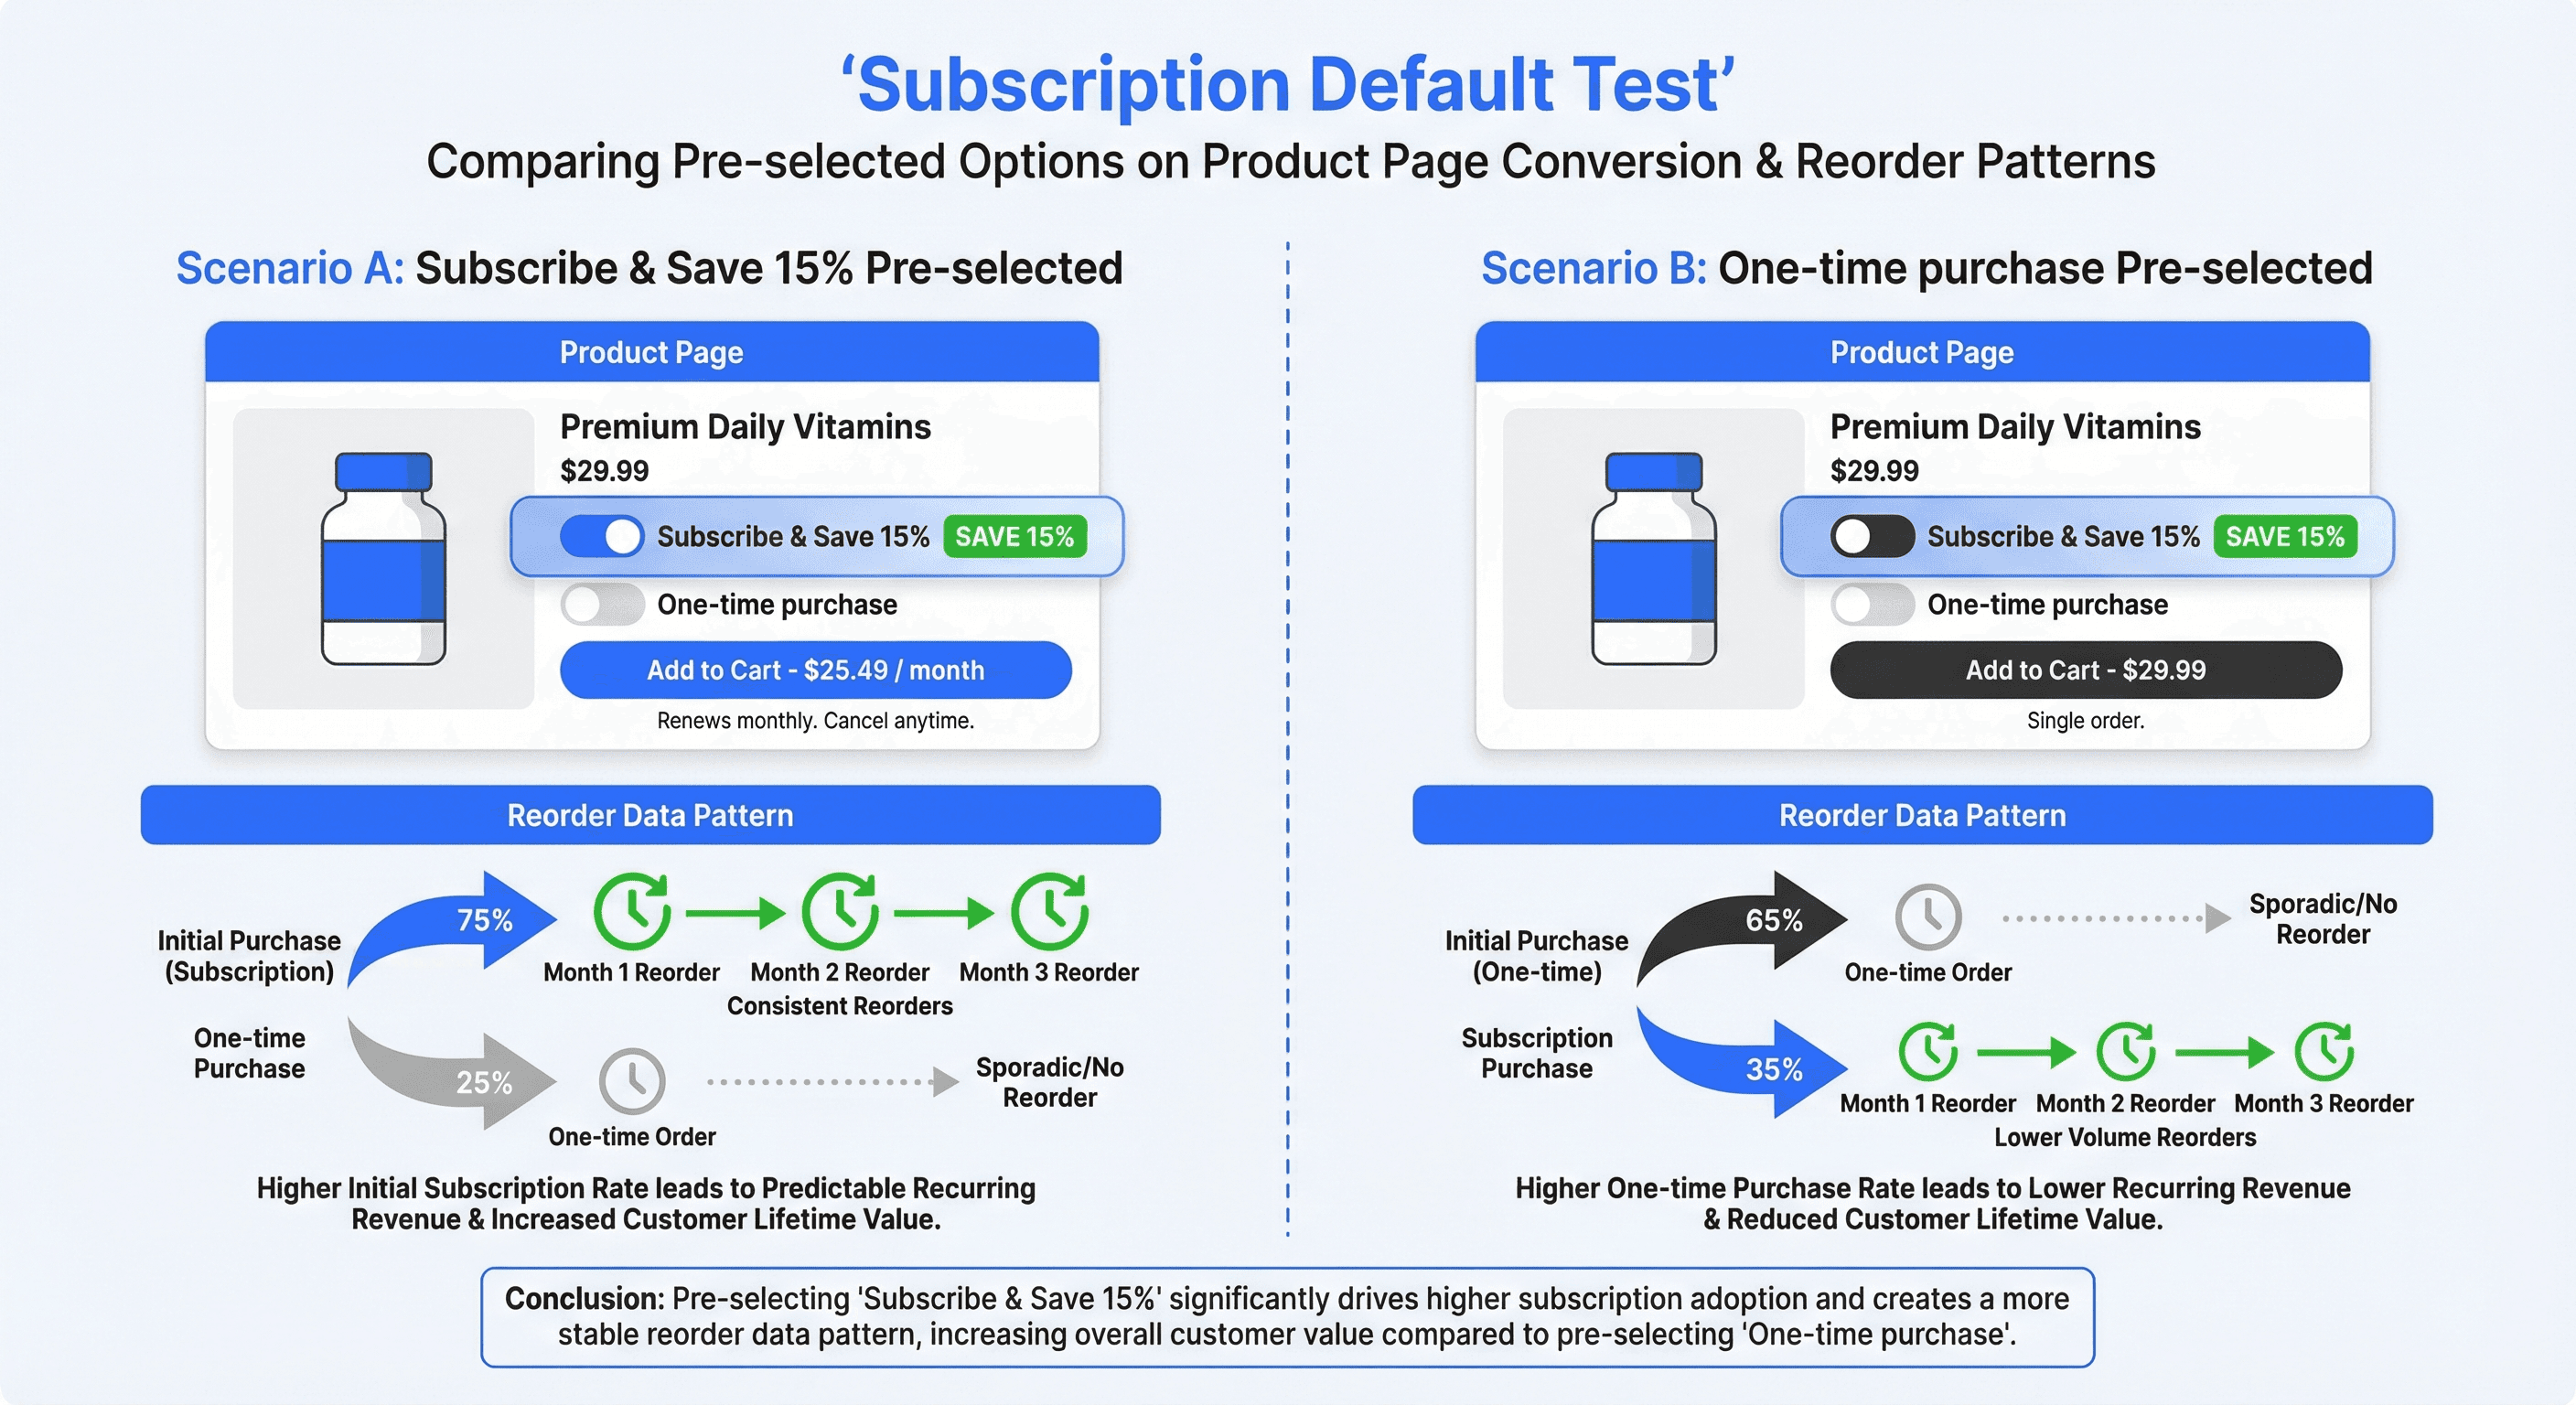
1. Subscription Default vs One-Time Default
Experimenting with subscriptions: How to test whether subscription models fit your customer behavior.
Your data signal: High manual reorder rate at consistent intervals
If you're seeing customers manually reorder the same product every three weeks like clockwork, that pattern is telling you something. They've already decided they want this on repeat. The friction is in the process, not the commitment.
This could indicate that your subscription option isn't visible enough, or that one-time purchase as the default is creating an unnecessary hurdle. Pricing your subscriptions right is key to retention. When customers are already behaving like subscribers, the question becomes whether the page experience matches their intent.
What you might explore: Pre-selected subscription option vs one-time purchase as the default
Track this to understand: Profit per visitor, subscription uptake rate, 90-day retention
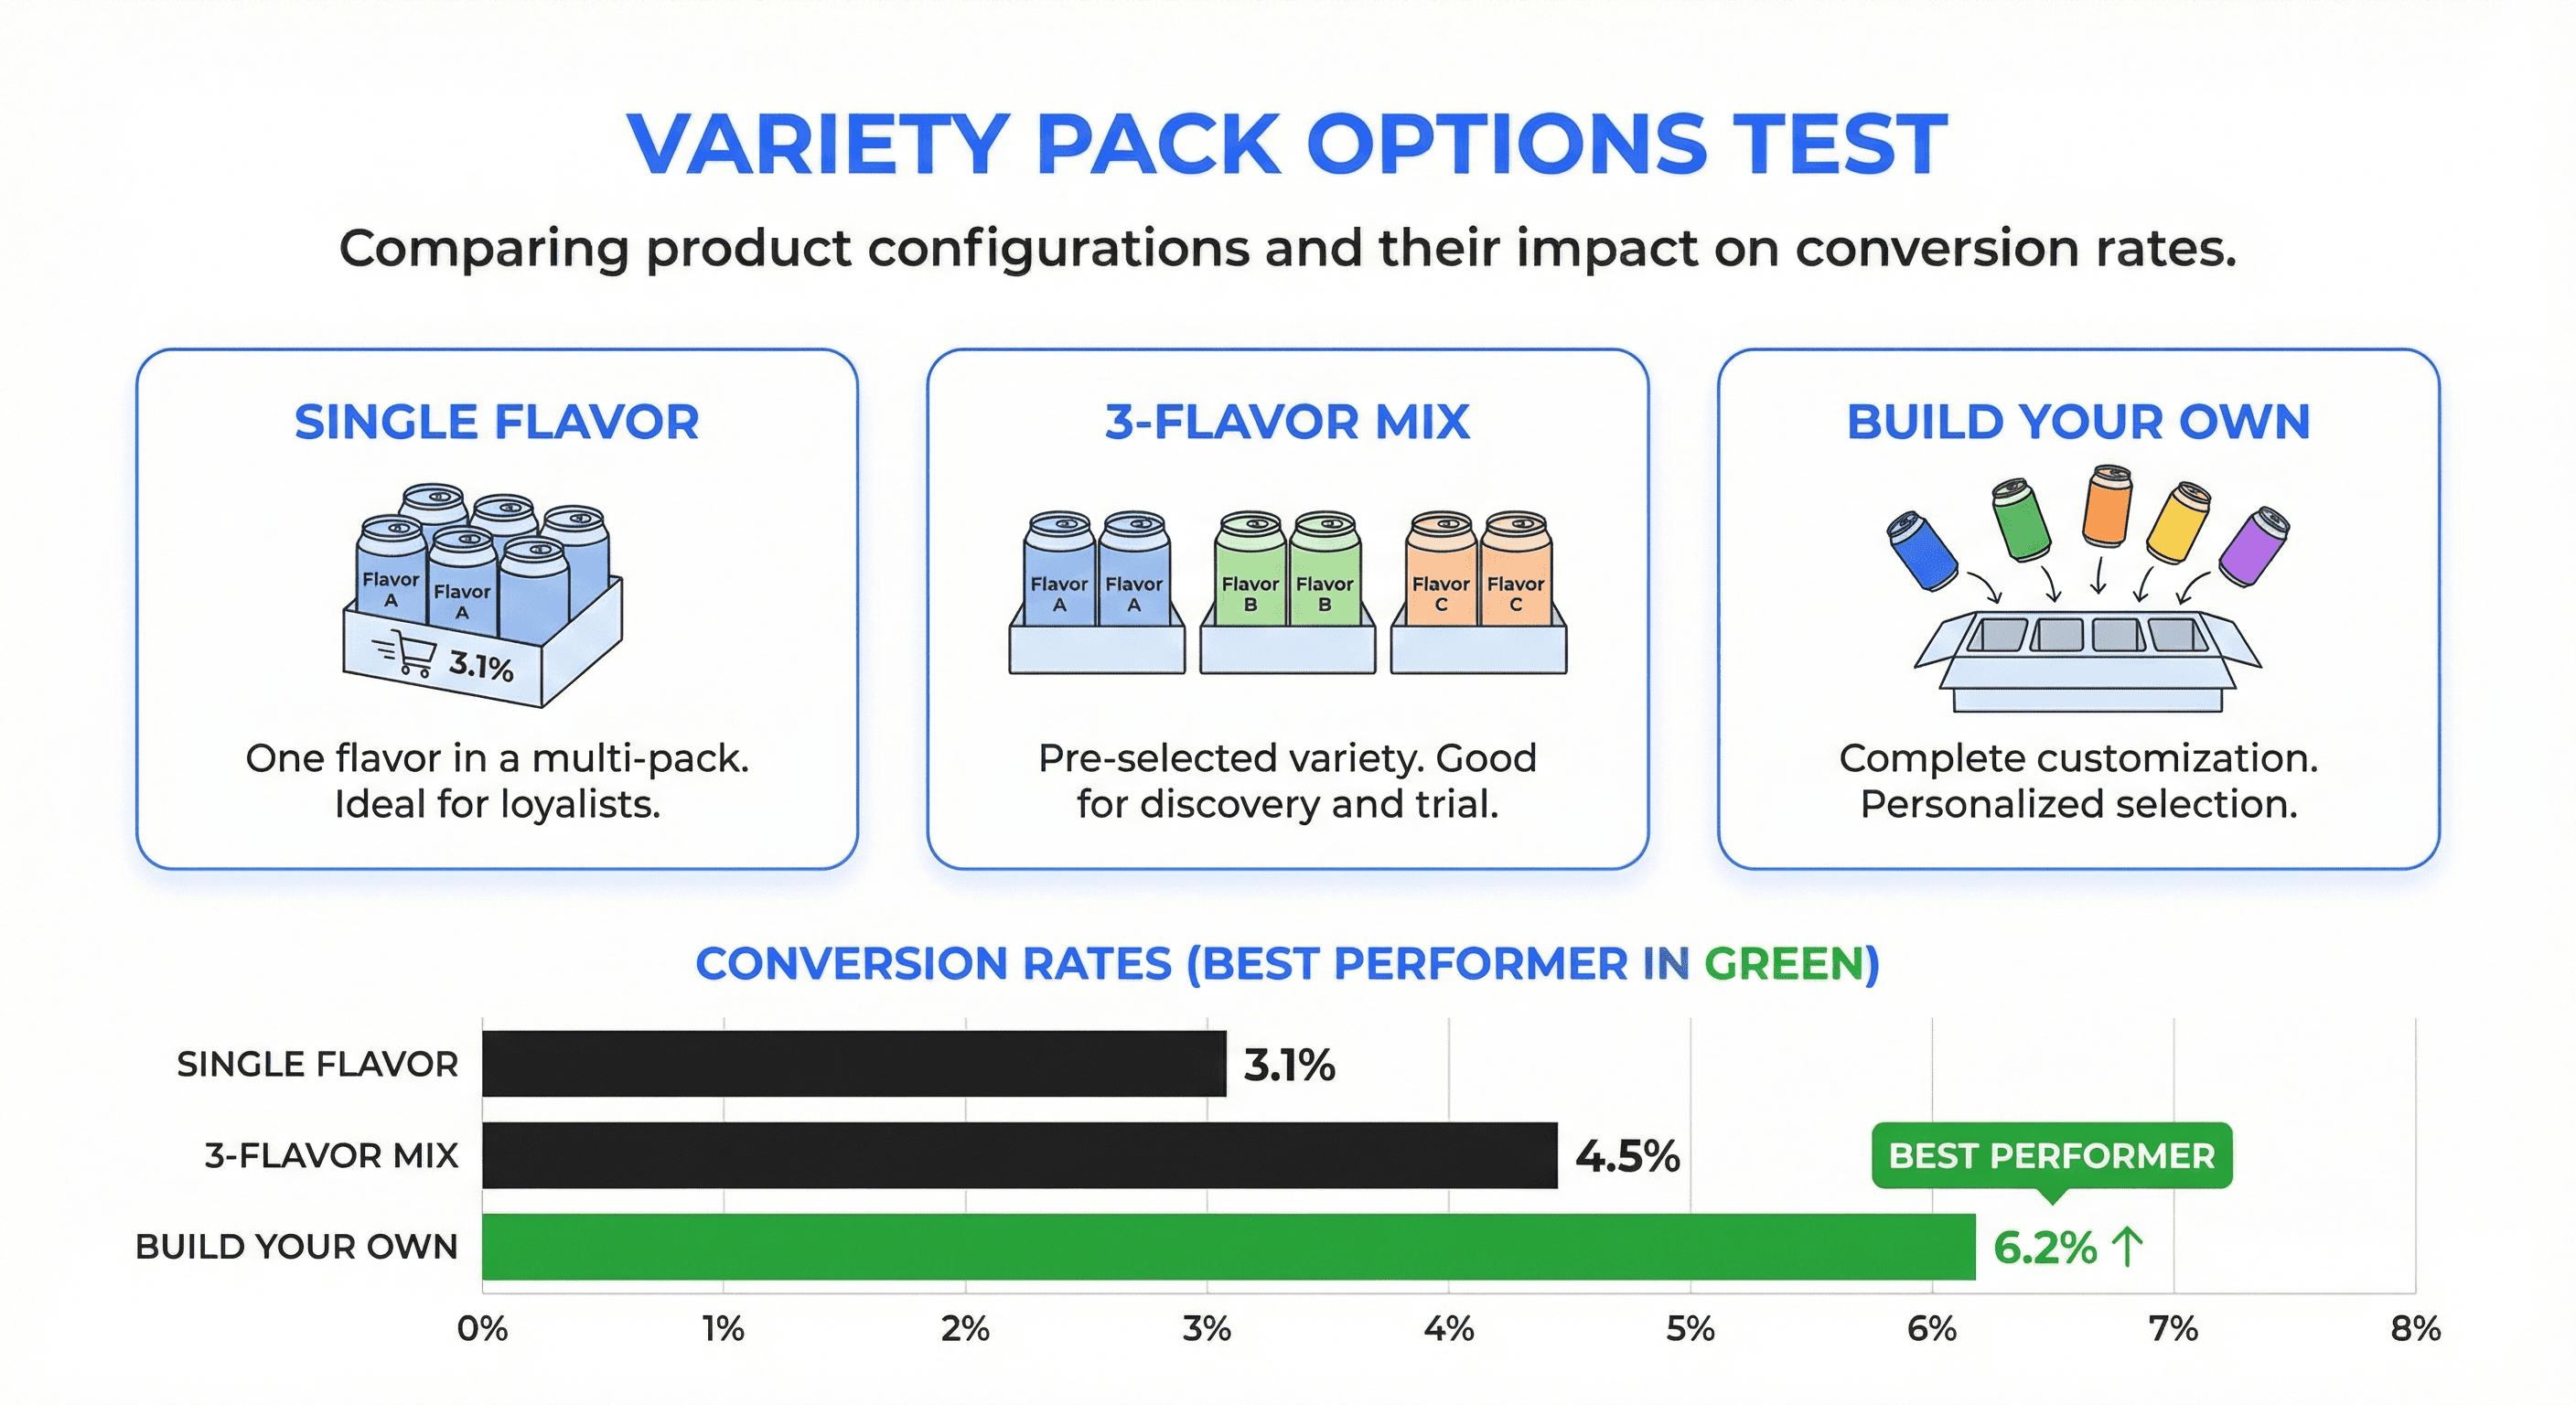
2. Variety Pack vs Single Flavor First Order
Your data signal: High single-flavor first orders followed by variety exploration
If your data shows customers picking one safe flavor first, then branching out to mango or watermelon on orders two and three, that's a discovery pattern worth investigating.
This pattern often points to risk aversion on the first purchase. New customers don't want to commit to something unfamiliar. A variety pack could compress that exploration into order one, letting them find their favorite faster. This is one way to increase AOV while improving first-order value. Whether that increases overall value depends on your specific customer behavior.
What you might explore: Variety pack prominently featured on homepage and collection pages vs single flavor options
Track this to understand: Profit per visitor, second order rate
3. Pack Size Optimization
Your data signal: Reorder frequency and quantity patterns
Look at how often customers come back and how much they buy. If they're reordering 12-packs every two weeks, that frequency might be telling you the pack size doesn't match actual consumption.
This could indicate an opportunity to reduce friction. The right pack size isn't about what fits in a cabinet. It's about matching your product to how customers actually use it. Your reorder data already contains clues about what that match might look like.
What you might explore: 12-pack vs 24-pack vs 36-pack with pricing and positioning variations
Track this to understand: Profit per visitor, units per order, reorder frequency
4. Occasion-Based Messaging
Your data signal: Traffic sources (fitness sites vs general wellness vs outdoor activities)
If you're seeing different conversion rates from different traffic sources, that variance is worth investigating. Someone clicking through from a fitness blog is in a different headspace than someone coming from a wellness newsletter.
This pattern often points to a messaging opportunity. The same product solves different problems for different people. If your data shows clear segments in where traffic comes from, testing occasion-based messaging using experiences might reveal which framing resonates with each group.
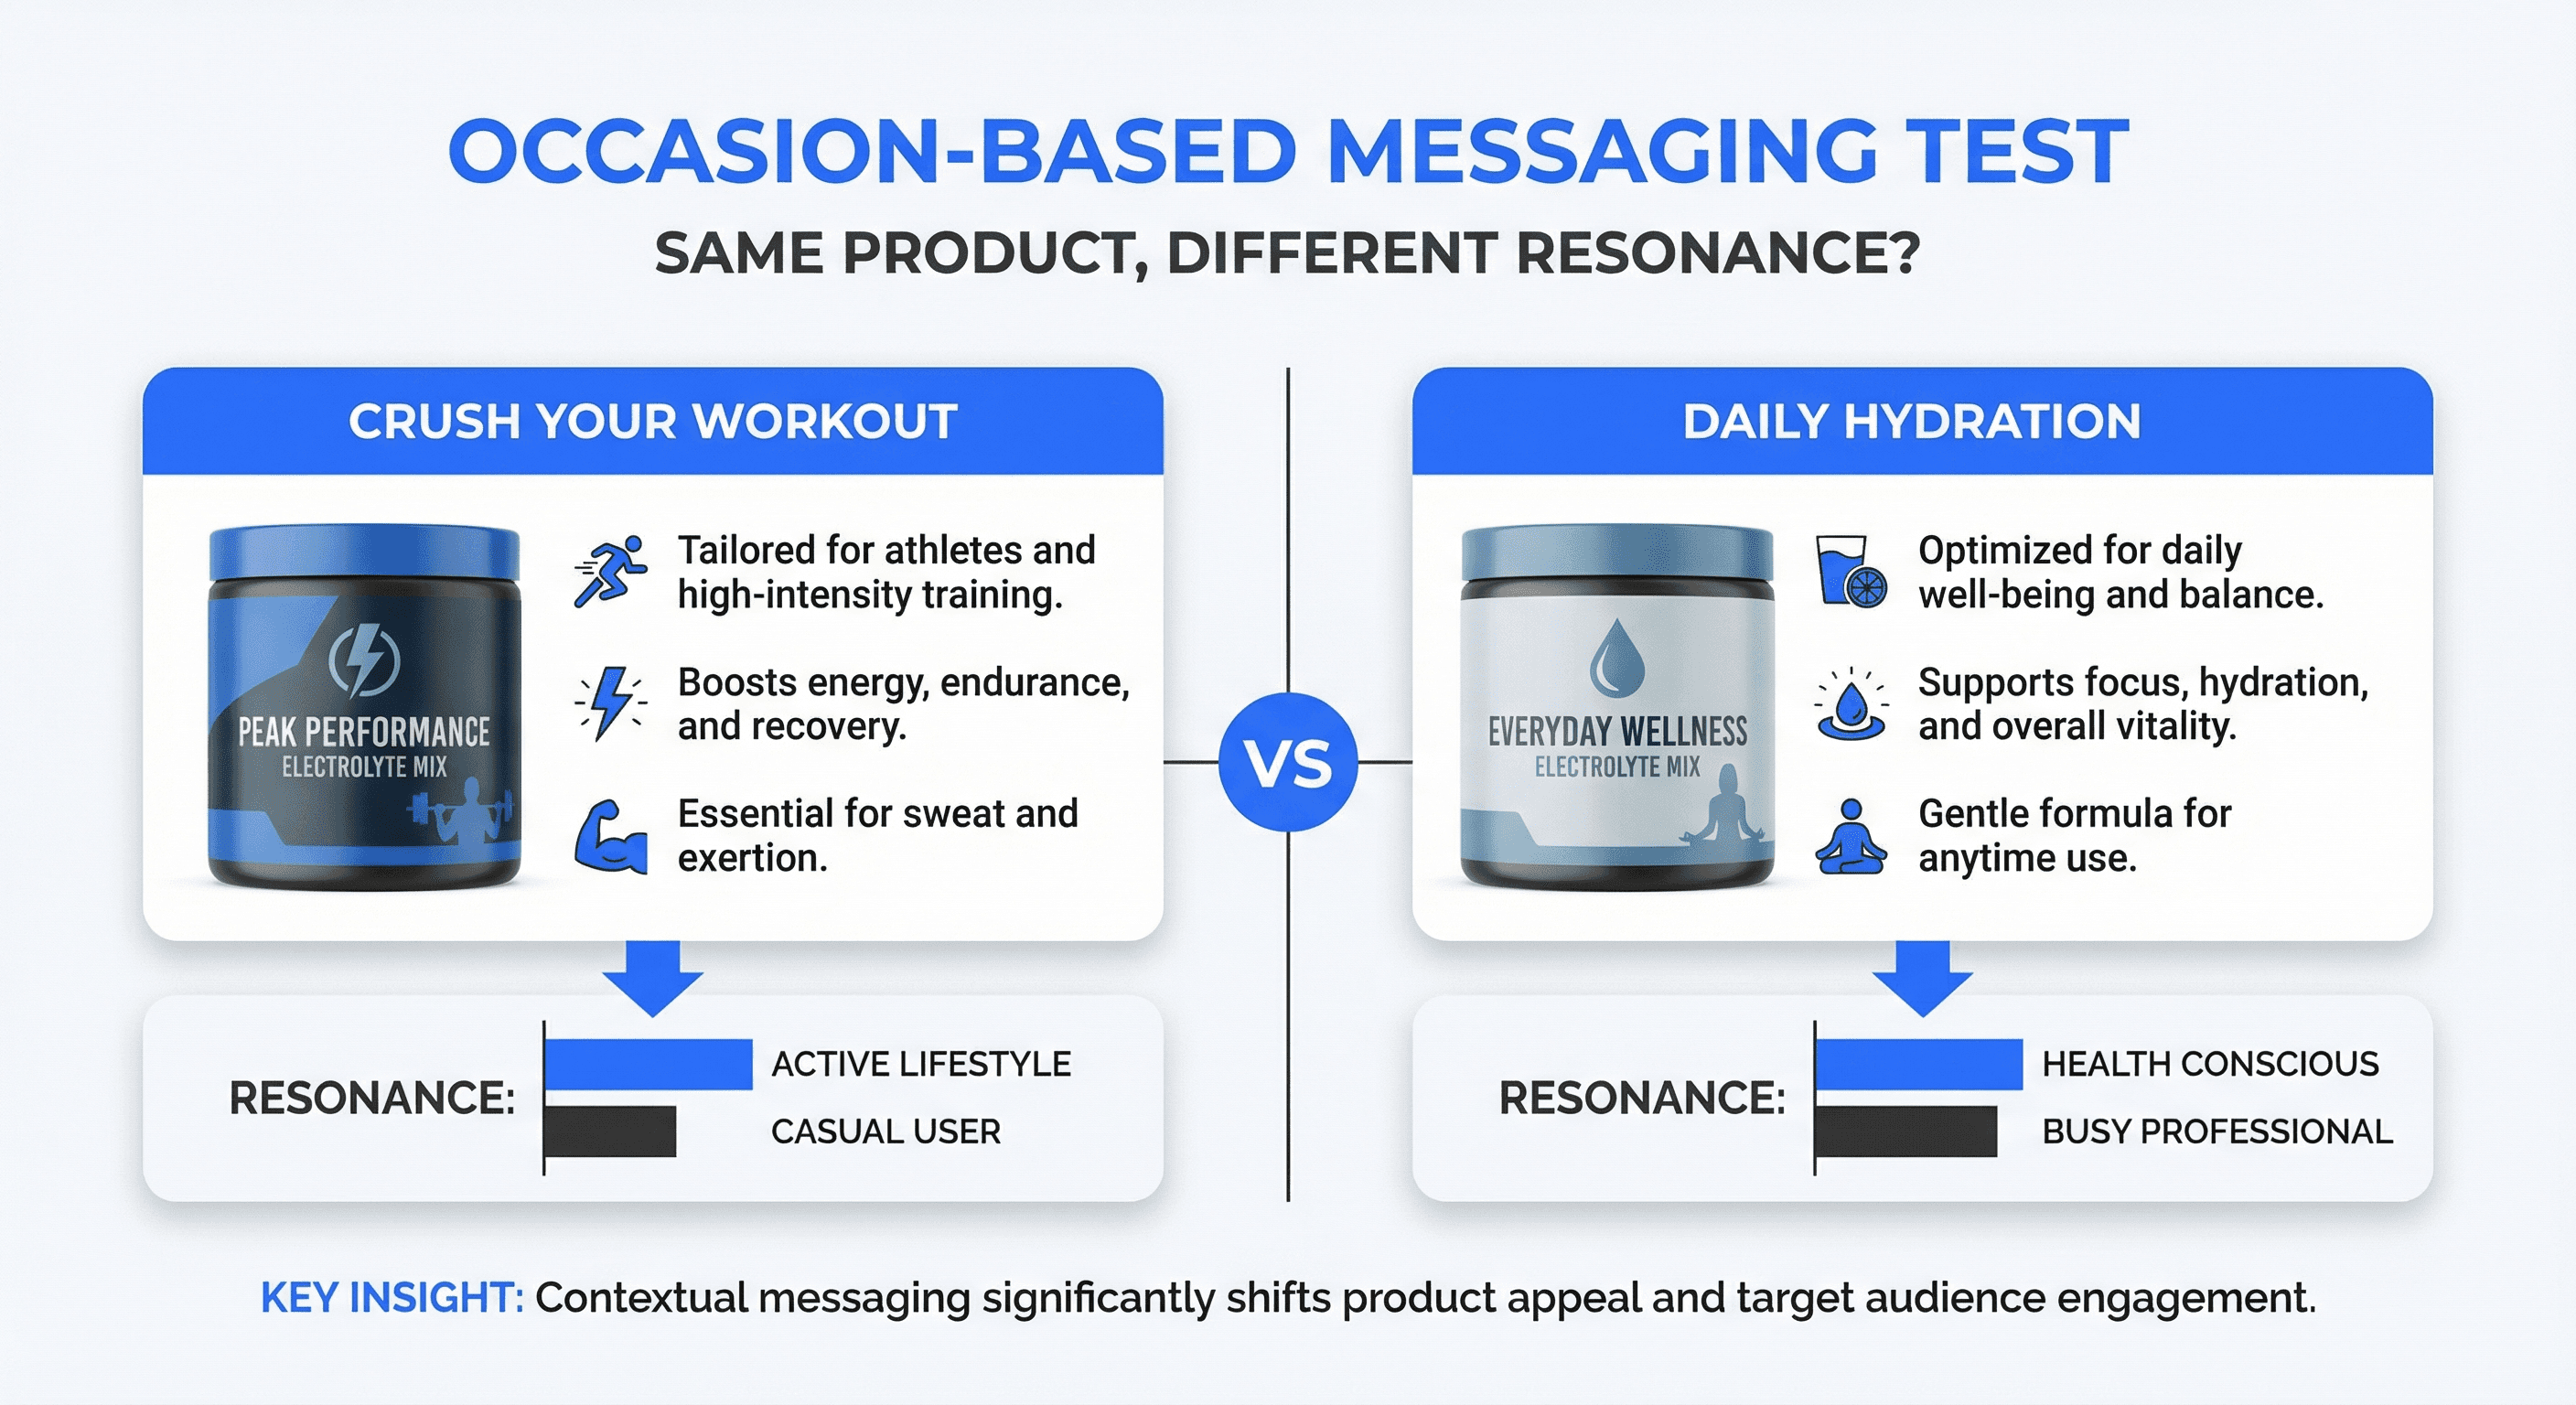
What you might explore: Workout/recovery messaging vs daily hydration messaging, segmented by traffic source
Track this to understand: Profit per visitor by traffic source, conversion rate by segment
5. Influencer vs Customer Social Proof
Your data signal: Conversion rate by landing page variant
Athlete endorsements feel like table stakes in the drink category. But if you're seeing different performance across pages with different types of social proof, that's worth exploring further.
Customer reviews offer a different kind of proof than sponsored athletes. Less aspirational, more relatable. The assumption that athlete endorsements work better might not hold for your specific audience. Content testing can reveal the truth. Your conversion data can help you investigate which type of social proof actually moves your customers.
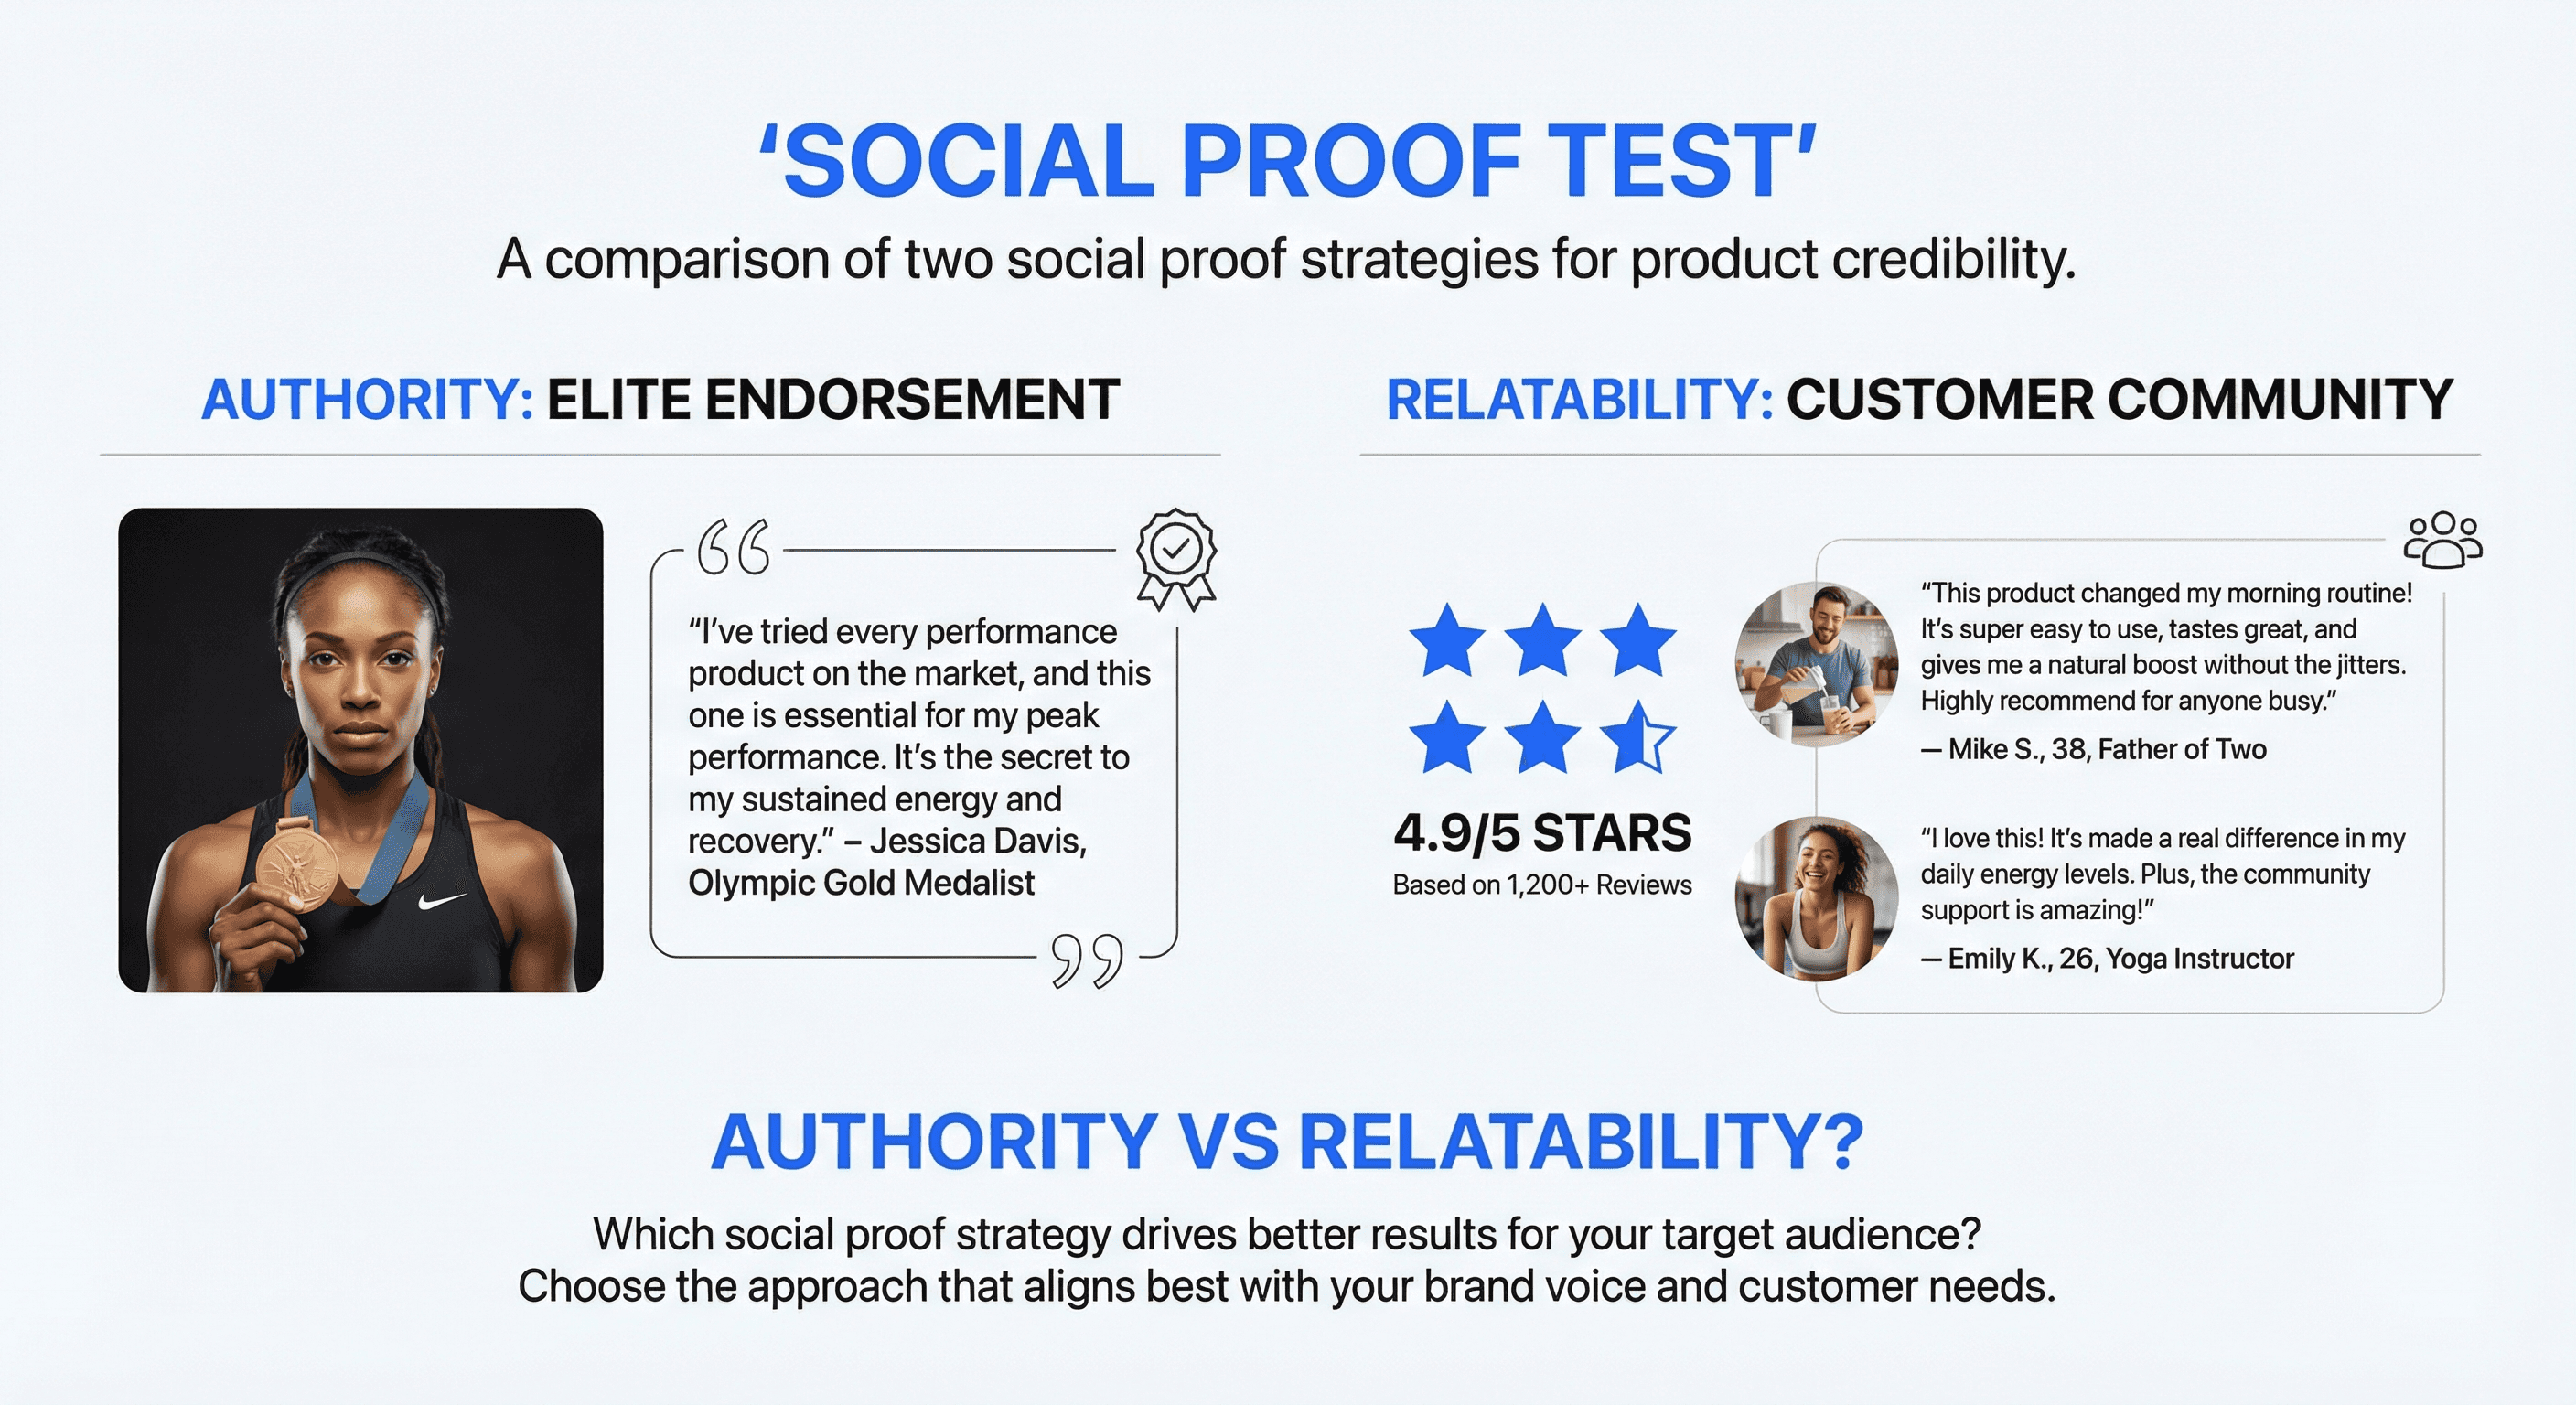
What you might explore: Athlete testimonial prominent vs customer reviews prominent vs no social proof
Track this to understand: Profit per visitor, conversion rate, time on page
Your Data Points the Way
These signals are starting points, not a checklist. The experiments worth running for your brand depend on what your own data is telling you.
If reorder patterns show predictable intervals, subscription defaults might be worth exploring
If first orders cluster around safe flavors, variety packs could compress discovery
If pack sizes don't match consumption frequency, sizing experiments might reduce friction
If traffic sources show clear segments, messaging tests could reveal what each group needs
If you're unsure which social proof works, let conversion data guide the investigation
Your data tells you what to test. Start there.
AB Testing
AB Testing
AB Testing


